6. Normal Distribution and Continuous Random Variables
Probabilities & Z-Scores w/ Graphing Calculator
Problem 6.1.50
Textbook Question
Distributions In a continuous uniform distribution,
a. Find the mean and standard deviation for the distribution of the waiting times represented in Figure 6-2, which accompanies Exercises 5–8.
 Verified video answer for a similar problem:
This video solution was recommended by our tutors as helpful for the problem above
Video duration:
1mWas this helpful?
Key Concepts
Here are the essential concepts you must grasp in order to answer the question correctly.
Continuous Uniform Distribution
A continuous uniform distribution is a probability distribution where all outcomes are equally likely within a specified range. This means that any value between the minimum and maximum is equally probable, leading to a flat probability density function. The distribution is defined by its two parameters: the minimum and maximum values, which determine the range of possible outcomes.
Recommended video:
Guided course

 06:38
06:38Intro to Frequency Distributions
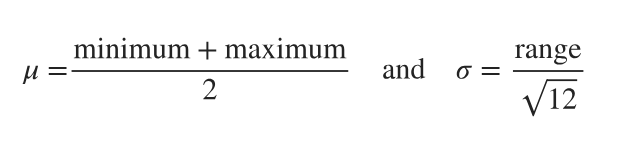
Mean of a Uniform Distribution
The mean (μ) of a continuous uniform distribution is calculated as the average of the minimum and maximum values. It represents the central point of the distribution and is given by the formula μ = (minimum + maximum) / 2. This value indicates where the center of the distribution lies, providing insight into the expected value of a random variable drawn from this distribution.
Recommended video:
Guided course
 03:28
03:28Mean & Standard Deviation of Binomial Distribution
Standard Deviation of a Uniform Distribution
The standard deviation (σ) of a continuous uniform distribution measures the spread of the distribution around the mean. It is calculated using the formula σ = range / √12, where the range is the difference between the maximum and minimum values. A larger standard deviation indicates a wider spread of values, while a smaller standard deviation suggests that the values are closer to the mean.
Recommended video:
Guided course
 08:45
08:45Calculating Standard Deviation
 7:09m
7:09mWatch next
Master Probability From Given Z-Scores - TI-84 (CE) Calculator with a bite sized video explanation from Patrick
Start learningRelated Videos
Related Practice


