3. Describing Data Numerically
Standard Deviation
Problem 3.3.22
Textbook Question
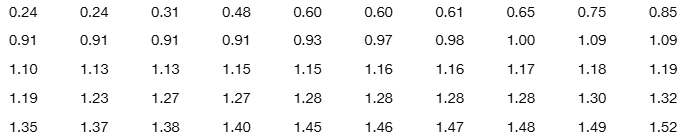
In Exercises 21–28, use the same list of cell phone radiation levels given for Exercises 17–20. Find the indicated percentile or quartile.
Q1
 Verified step by step guidance
1
Step 1: Understand the problem. The goal is to find Q1, the first quartile, which represents the 25th percentile of the data. This means identifying the value below which 25% of the data falls.
Step 2: Organize the data. The provided list of cell phone radiation levels is already sorted in ascending order, which is necessary for calculating quartiles.
Step 3: Determine the position of Q1 in the sorted data. Use the formula for the position of a quartile: P = (n + 1) * (percentile / 100), where n is the total number of data points. For Q1, the percentile is 25%.
Step 4: Calculate the position using the formula. Substitute the total number of data points (n) into the formula to find the position of Q1. If the position is not an integer, interpolate between the two closest data points.
Step 5: Identify the value corresponding to the calculated position in the sorted data. This value is Q1, the first quartile.
Verified video answer for a similar problem:This video solution was recommended by our tutors as helpful for the problem above
Video duration:
2mWas this helpful?
Key Concepts
Here are the essential concepts you must grasp in order to answer the question correctly.
Percentiles
Percentiles are measures that indicate the relative standing of a value within a dataset. Specifically, the nth percentile is the value below which n percent of the data falls. For example, the 25th percentile (Q1) is the value below which 25% of the observations lie, helping to understand the distribution of data points.
Quartiles
Quartiles are specific percentiles that divide a dataset into four equal parts. The first quartile (Q1) represents the 25th percentile, the second quartile (Q2) is the median or 50th percentile, and the third quartile (Q3) is the 75th percentile. Quartiles are useful for summarizing data and identifying the spread and center of a dataset.
Recommended video:
Guided course

 04:51
04:51Find 5-Number Summary - TI-84 Calculator
Data Distribution
Data distribution refers to how values are spread or arranged in a dataset. Understanding the distribution is crucial for interpreting percentiles and quartiles, as it affects the calculation of these measures. A dataset can be normally distributed, skewed, or uniform, which influences the interpretation of statistical measures and the overall analysis.
Recommended video:
Guided course
 04:39
04:39Visualizing Qualitative vs. Quantitative Data
 8:45m
8:45mWatch next
Master Calculating Standard Deviation with a bite sized video explanation from Patrick
Start learningRelated Videos
Related Practice

