3. Describing Data Numerically
Standard Deviation
Problem 3.3.23
Textbook Question
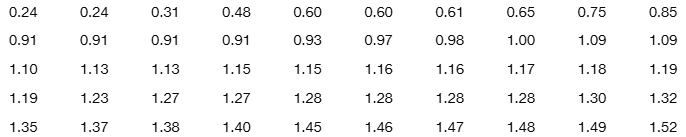
In Exercises 21–28, use the same list of cell phone radiation levels given for Exercises 17–20. Find the indicated percentile or quartile.
Q3
 Verified step by step guidance
1
Step 1: Arrange the data in ascending order. The data provided in the image is already sorted in ascending order.
Step 2: Determine the position of Q3 (the third quartile). Q3 corresponds to the 75th percentile, which can be calculated using the formula: , where k = 75, n = 100 (percentile scale), and N = total number of data points.
Step 3: Calculate the position of Q3 using the formula. If the position is not an integer, round up to the nearest whole number to find the rank of the data point corresponding to Q3.
Step 4: Locate the value in the sorted data set that corresponds to the calculated position. This value represents Q3.
Step 5: Interpret the result. Q3 divides the data set such that 75% of the values are below it and 25% are above it.
Verified video answer for a similar problem:This video solution was recommended by our tutors as helpful for the problem above
Video duration:
2mWas this helpful?
Key Concepts
Here are the essential concepts you must grasp in order to answer the question correctly.
Percentiles
A percentile is a measure used in statistics to indicate the value below which a given percentage of observations fall. For example, the 25th percentile (Q1) is the value below which 25% of the data points lie. Understanding percentiles helps in interpreting the distribution of data and comparing individual scores to a larger dataset.
Quartiles
Quartiles are specific percentiles that divide a dataset into four equal parts. The first quartile (Q1) marks the 25th percentile, the second quartile (Q2) is the median or 50th percentile, and the third quartile (Q3) is the 75th percentile. Quartiles provide insights into the spread and center of the data, making them essential for descriptive statistics.
Recommended video:
Guided course

 04:51
04:51Find 5-Number Summary - TI-84 Calculator
Data Distribution
Data distribution refers to how values are spread or arranged in a dataset. It can be visualized through graphs like histograms or box plots, which help identify patterns such as skewness or outliers. Understanding the distribution is crucial for accurately calculating percentiles and quartiles, as these measures depend on the arrangement of data points.
Recommended video:
Guided course
 04:39
04:39Visualizing Qualitative vs. Quantitative Data
 8:45m
8:45mWatch next
Master Calculating Standard Deviation with a bite sized video explanation from Patrick
Start learningRelated Videos
Related Practice

