3. Describing Data Numerically
Standard Deviation
Problem 3.3.21
Textbook Question
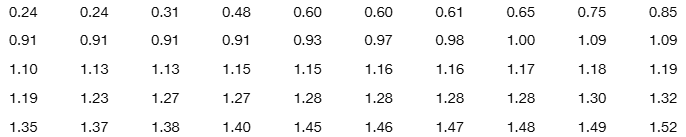
In Exercises 21–28, use the same list of cell phone radiation levels given for Exercises 17–20. Find the indicated percentile or quartile.
P30
 Verified step by step guidance
1
Step 1: Arrange the data in ascending order. The data provided in the image is already sorted in ascending order, so no further action is needed for this step.
Step 2: Determine the position of the 30th percentile (P30) using the formula: , where is the percentile (30 in this case) and is the total number of data points.
Step 3: Count the total number of data points in the dataset. From the image, there are 40 data points.
Step 4: Calculate the position of P30 using the formula. Substitute = 30 and = 40 into the formula to find the position.
Step 5: Locate the value corresponding to the calculated position in the sorted dataset. If the position is not an integer, interpolate between the two closest values.
Verified video answer for a similar problem:This video solution was recommended by our tutors as helpful for the problem above
Video duration:
2mWas this helpful?
Key Concepts
Here are the essential concepts you must grasp in order to answer the question correctly.
Percentiles
A percentile is a measure used in statistics to indicate the value below which a given percentage of observations fall. For example, the 30th percentile (P30) is the value below which 30% of the data points lie. To find a specific percentile, the data must be ordered from least to greatest, and then the appropriate position can be calculated using the formula: P = (n + 1) * (percentile/100), where n is the number of data points.
Quartiles
Quartiles are specific percentiles that divide a dataset into four equal parts. The first quartile (Q1) represents the 25th percentile, the second quartile (Q2) is the median or 50th percentile, and the third quartile (Q3) is the 75th percentile. Quartiles help summarize the distribution of data and are useful for identifying outliers and understanding the spread of the dataset.
Recommended video:
Guided course

 04:51
04:51Find 5-Number Summary - TI-84 Calculator
Data Ordering
Data ordering is the process of arranging data points in a specific sequence, typically from smallest to largest. This step is crucial for calculating percentiles and quartiles, as it allows for accurate identification of the position of values within the dataset. Properly ordered data ensures that statistical measures reflect the true distribution and characteristics of the data being analyzed.
Recommended video:
Guided course
 04:39
04:39Visualizing Qualitative vs. Quantitative Data
 8:45m
8:45mWatch next
Master Calculating Standard Deviation with a bite sized video explanation from Patrick
Start learningRelated Videos
Related Practice

