11. Correlation
Correlation Coefficient
Problem 13.6.7
Textbook Question
Testing for Rank Correlation
In Exercises 7–12, use the rank correlation coefficient to test for a correlation between the two variables. Use a significance level of α = 0.05.
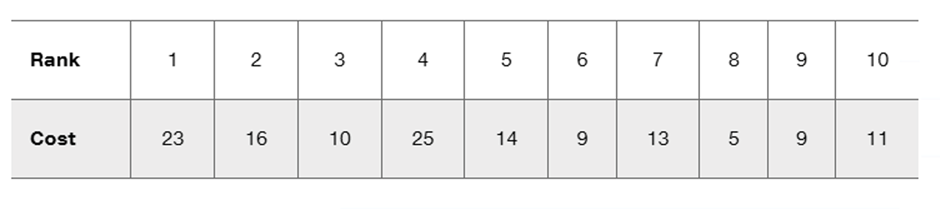
Colombian Coffee The following table lists quality rankings and costs (dollars) for a pound of different brands of Colombian coffee (based on data from Consumer Reports). Lower values of the quality rankings correspond to better coffee. Do the more expensive brands appear to have better quality?
 Verified step by step guidance
1
Step 1: Organize the data into two columns: one for the quality rankings and one for the costs. The quality rankings are already provided in ascending order (1 to 10), and the corresponding costs are listed below each rank.
Step 2: Assign ranks to the costs in ascending order. For example, the smallest cost gets rank 1, the second smallest gets rank 2, and so on. If there are ties, assign the average rank to the tied values.
Step 3: Calculate the difference (d) between the ranks of the quality rankings and the ranks of the costs for each brand. Then, square these differences (d²).
Step 4: Use the formula for Spearman's rank correlation coefficient: , where Σd² is the sum of the squared differences, and n is the number of pairs (in this case, n = 10).
Step 5: Compare the calculated Spearman's rank correlation coefficient (rs) to the critical value for α = 0.05 and n = 10. If |rs| exceeds the critical value, there is a significant correlation between the quality rankings and costs. Otherwise, there is no significant correlation.
Verified video answer for a similar problem:This video solution was recommended by our tutors as helpful for the problem above
Video duration:
4mWas this helpful?
Key Concepts
Here are the essential concepts you must grasp in order to answer the question correctly.
Rank Correlation Coefficient
The rank correlation coefficient, often denoted as Spearman's rho, measures the strength and direction of association between two ranked variables. It assesses how well the relationship between the variables can be described using a monotonic function. A positive value indicates that as one variable increases, the other tends to increase, while a negative value suggests an inverse relationship.
Recommended video:
Guided course

 05:43
05:43Correlation Coefficient
Significance Level (α)
The significance level, denoted as α, is the threshold used to determine whether a statistical result is significant. In hypothesis testing, it represents the probability of rejecting the null hypothesis when it is actually true (Type I error). A common significance level is 0.05, meaning there is a 5% risk of concluding that a correlation exists when there is none.
Recommended video:
Guided course
 04:46
04:46Step 4: State Conclusion Example 4
Hypothesis Testing
Hypothesis testing is a statistical method used to make inferences about population parameters based on sample data. It involves formulating a null hypothesis (no effect or no correlation) and an alternative hypothesis (there is an effect or correlation). The test evaluates the evidence against the null hypothesis using a test statistic and the significance level to determine whether to reject or fail to reject the null hypothesis.
Recommended video:
Guided course
 06:21
06:21Step 1: Write Hypotheses
 5:43m
5:43mWatch next
Master Correlation Coefficient with a bite sized video explanation from Patrick
Start learning