11. Correlation
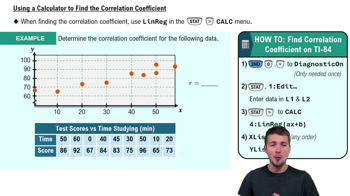
Correlation Coefficient
Problem 13.6.5
Textbook Question
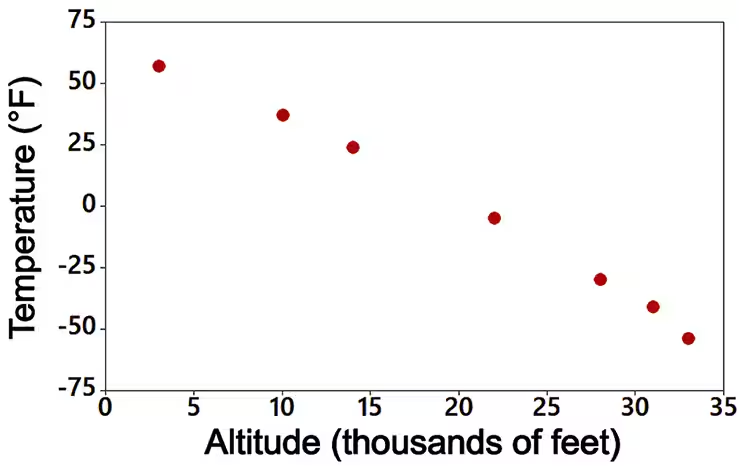
In Exercises 5 and 6, use the scatterplot to find the value of the rank correlation coefficient and the critical values corresponding to a 0.05 significance level used to test the null hypothesis of . Determine whether there is a correlation.
Altitude and Temperature Shown below is a scatterplot of altitudes (thousands of feet) and outside air temperatures (degrees Fahrenheit) recorded by the author during a Delta flight from New Orleans to Atlanta.
 Verified step by step guidance
1
Step 1: Understand the problem. The goal is to calculate the rank correlation coefficient (Spearman's rho) for the given data and compare it to the critical value at a 0.05 significance level to determine if there is a significant correlation between altitude and temperature.
Step 2: Rank the data. Assign ranks to the altitude values and the corresponding temperature values. If there are tied values, assign the average rank to the tied values.
Step 3: Calculate the difference in ranks (d) for each pair of altitude and temperature. Then, square these differences (d^2) for each pair.
Step 4: Use the formula for Spearman's rank correlation coefficient: , where n is the number of data points.
Step 5: Compare the calculated rank correlation coefficient (ęŽ) to the critical value for a 0.05 significance level. If |ęŽ| is greater than the critical value, reject the null hypothesis and conclude that there is a significant correlation. Otherwise, fail to reject the null hypothesis.
Verified video answer for a similar problem:This video solution was recommended by our tutors as helpful for the problem above
Video duration:
2mWas this helpful?
Key Concepts
Here are the essential concepts you must grasp in order to answer the question correctly.
Rank Correlation Coefficient
The rank correlation coefficient, often denoted as Spearman's rho, measures the strength and direction of the association between two ranked variables. It assesses how well the relationship between the variables can be described using a monotonic function. A value close to +1 indicates a strong positive correlation, while a value close to -1 indicates a strong negative correlation. In this context, it will help determine the correlation between altitude and temperature.
Recommended video:
Guided course

 05:43
05:43Correlation Coefficient
Null Hypothesis
The null hypothesis is a statement that there is no effect or no relationship between two measured phenomena. In this case, it posits that there is no correlation between altitude and temperature. Testing this hypothesis involves statistical methods to determine if observed data significantly deviates from what would be expected under the null hypothesis, often using a significance level, such as 0.05, to assess the results.
Recommended video:
Guided course
 06:21
06:21Step 1: Write Hypotheses
Critical Values
Critical values are the threshold points that define the boundaries for rejecting the null hypothesis in hypothesis testing. They are determined based on the significance level (e.g., 0.05) and the distribution of the test statistic. If the calculated test statistic exceeds the critical value, the null hypothesis can be rejected, indicating a statistically significant correlation. In this scenario, critical values will help assess whether the correlation between altitude and temperature is significant.
Recommended video:
 05:50
05:50Critical Values: t-Distribution
 5:43m
5:43mWatch next
Master Correlation Coefficient with a bite sized video explanation from Patrick
Start learning