11. Correlation
Correlation Coefficient
Problem 13.6.8
Textbook Question
Testing for Rank Correlation
In Exercises 7–12, use the rank correlation coefficient to test for a correlation between the two variables. Use a significance level of α = 0.05.
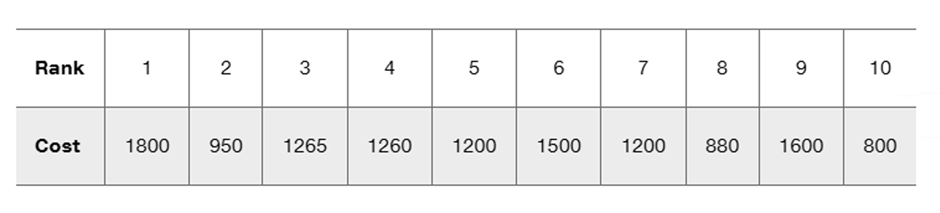
Computers The following table lists quality rankings and costs (dollars) for different brands of laptop computers with 12 in. or 13 in. screens (based on data from Consumer Reports). Lower values of the quality rankings correspond to better computers. Do the more expensive brands appear to have better quality?
 Verified step by step guidance
1
Step 1: Understand the problem. We are tasked with testing for a rank correlation between two variables: quality rankings (Rank) and costs (Cost) of laptop computers. Lower rank values correspond to better quality. The goal is to determine if more expensive laptops tend to have better quality using the rank correlation coefficient (Spearman's rank correlation). The significance level is α = 0.05.
Step 2: Assign ranks to the data. The Rank column already provides the quality rankings. For the Cost column, assign ranks based on the values, with the smallest cost receiving rank 1, the second smallest cost receiving rank 2, and so on. If there are ties, assign the average rank to the tied values.
Step 3: Calculate the difference in ranks (d) for each pair of Rank and Cost. For each laptop, subtract the rank of Cost from the rank of Quality (Rank). Then, square these differences to obtain d².
Step 4: Compute the Spearman's rank correlation coefficient (“œ) using the formula: , where n is the number of pairs (in this case, 10). Substitute the values of d¬≤ and n into the formula.
Step 5: Compare the calculated “œ value to the critical value for Spearman's rank correlation at Œ± = 0.05 and n = 10. If |“œ| exceeds the critical value, reject the null hypothesis and conclude that there is a significant correlation between cost and quality rankings. Otherwise, fail to reject the null hypothesis.
Verified video answer for a similar problem:This video solution was recommended by our tutors as helpful for the problem above
Video duration:
8mWas this helpful?
Key Concepts
Here are the essential concepts you must grasp in order to answer the question correctly.
Rank Correlation Coefficient
The rank correlation coefficient, often denoted as Spearman's rho, measures the strength and direction of association between two ranked variables. It assesses how well the relationship between the two variables can be described using a monotonic function. A positive value indicates that as one variable increases, the other tends to increase, while a negative value suggests the opposite. This coefficient is particularly useful when the data does not meet the assumptions of parametric tests.
Recommended video:
Guided course

 05:43
05:43Correlation Coefficient
Significance Level (α)
The significance level, denoted as α, is the threshold used to determine whether a statistical result is significant. In hypothesis testing, it represents the probability of rejecting the null hypothesis when it is actually true (Type I error). A common significance level is 0.05, meaning there is a 5% risk of concluding that a correlation exists when there is none. This level helps researchers decide whether to accept or reject the null hypothesis based on the p-value obtained from the analysis.
Recommended video:
Guided course
 04:46
04:46Step 4: State Conclusion Example 4
Hypothesis Testing
Hypothesis testing is a statistical method used to make inferences about population parameters based on sample data. It involves formulating a null hypothesis (H0) that states there is no effect or correlation, and an alternative hypothesis (H1) that suggests there is an effect or correlation. Researchers use sample data to calculate a test statistic and corresponding p-value, which are then compared to the significance level to determine whether to reject or fail to reject the null hypothesis, guiding conclusions about the data.
Recommended video:
Guided course
 06:21
06:21Step 1: Write Hypotheses
 5:43m
5:43mWatch next
Master Correlation Coefficient with a bite sized video explanation from Patrick
Start learning