2. Describing Data with Tables and Graphs
Histograms
Problem 2.2.6
Textbook Question
In Exercises 5–8, answer the questions by referring to the following Minitab-generated histogram, which depicts the weights (grams) of all quarters listed in Data Set 40 “Coin Weights” in Appendix B. (Grams are actually units of mass and the values shown on the horizontal scale are rounded.)
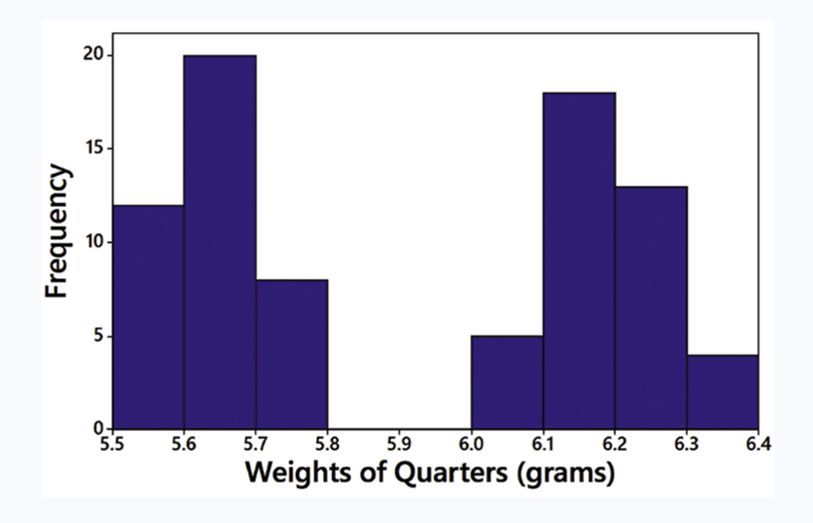
Class Width and Class Limits Give the approximate values of the class width, and the lower and upper class limits of the class depicted in the bar farthest to the left.
 Verified step by step guidance
1
Step 1: Identify the class width by observing the horizontal axis of the histogram. The class width is the difference between the lower boundary of one class and the lower boundary of the next class. For example, the first class starts at 5.5 and the next class starts at 5.6, so the class width is approximately 0.1 grams.
Step 2: Determine the lower class limit of the bar farthest to the left. The bar farthest to the left starts at 5.5 grams, which is the lower class limit for that class.
Step 3: Determine the upper class limit of the bar farthest to the left. The upper class limit is the value at the end of the class interval. Since the class width is 0.1 grams, the upper class limit for the first bar is approximately 5.6 grams.
Step 4: Verify the frequency of the bar farthest to the left. The height of the bar indicates the frequency, which appears to be approximately 10 based on the vertical axis.
Step 5: Summarize the findings: The class width is approximately 0.1 grams, the lower class limit is 5.5 grams, and the upper class limit is 5.6 grams for the bar farthest to the left.
Verified video answer for a similar problem:This video solution was recommended by our tutors as helpful for the problem above
Video duration:
2mWas this helpful?
Key Concepts
Here are the essential concepts you must grasp in order to answer the question correctly.
Histogram
A histogram is a graphical representation of the distribution of numerical data, where the data is divided into intervals or 'bins.' Each bin's height reflects the frequency of data points within that interval. In this case, the histogram displays the weights of quarters, allowing for visual analysis of how these weights are distributed across different ranges.
Recommended video:
Guided course

 05:54
05:54Intro to Histograms
Class Width
Class width refers to the range of values that each bin in a histogram covers. It is calculated by subtracting the lower limit of a class from its upper limit. For the leftmost bar in the histogram, identifying the class width is essential for understanding how the data is grouped and for making comparisons between different intervals.
Recommended video:
Guided course
 05:18
05:18How to Create Frequency Distributions Example 2
Class Limits
Class limits define the boundaries of each bin in a histogram. The lower class limit is the smallest value that can fall into that bin, while the upper class limit is the largest. For the leftmost bar in the histogram, determining these limits is crucial for accurately interpreting the data and understanding the specific range of weights represented.
Recommended video:
Guided course
 06:29
06:29How to Create Frequency Distributions

Related Videos
Related Practice

