2. Describing Data with Tables and Graphs
Histograms
Problem 2.2.5
Textbook Question
In Exercises 5–8, answer the questions by referring to the following Minitab-generated histogram, which depicts the weights (grams) of all quarters listed in Data Set 40 “Coin Weights” in Appendix B. (Grams are actually units of mass and the values shown on the horizontal scale are rounded.)
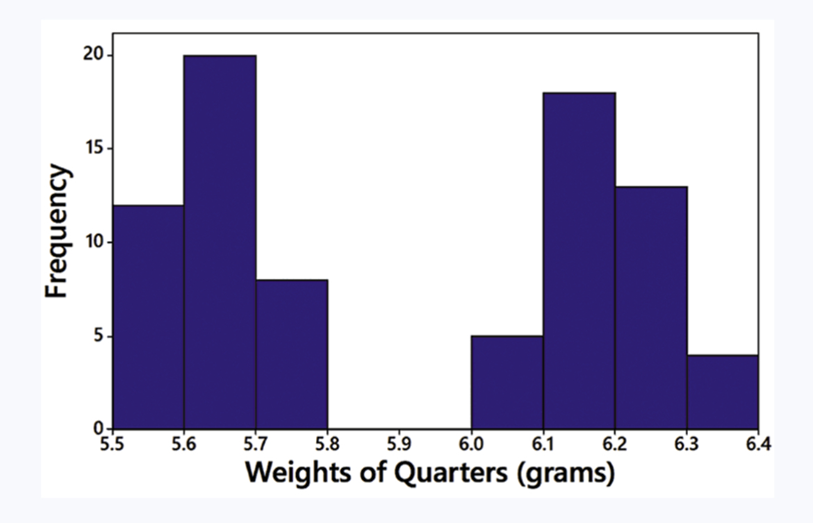
Sample Size What is the approximate number of quarters depicted in the three bars farthest to the left?
 Verified step by step guidance
1
Step 1: Observe the histogram provided. The horizontal axis represents the weights of quarters in grams, and the vertical axis represents the frequency (number of quarters) for each weight range.
Step 2: Identify the three bars farthest to the left on the histogram. These bars correspond to the weight ranges 5.5–5.6, 5.6–5.7, and 5.7–5.8 grams.
Step 3: Note the frequency values for each of these bars. From the histogram: the first bar (5.5–5.6 grams) has a frequency of approximately 10, the second bar (5.6–5.7 grams) has a frequency of approximately 20, and the third bar (5.7–5.8 grams) has a frequency of approximately 5.
Step 4: Add the frequencies of these three bars to determine the approximate total number of quarters depicted in the three bars farthest to the left. This involves summing the frequencies: 10 + 20 + 5.
Step 5: Conclude that the approximate number of quarters in the three bars farthest to the left is the sum obtained in Step 4.
Verified video answer for a similar problem:This video solution was recommended by our tutors as helpful for the problem above
Video duration:
3mWas this helpful?
Key Concepts
Here are the essential concepts you must grasp in order to answer the question correctly.
Histogram
A histogram is a graphical representation of the distribution of numerical data, where the data is divided into intervals (bins) on the x-axis, and the frequency of data points within each interval is represented by the height of the bars. In this case, the histogram shows the weights of quarters in grams, allowing for visual analysis of how many quarters fall within specific weight ranges.
Recommended video:
Guided course

 05:54
05:54Intro to Histograms
Frequency
Frequency refers to the number of occurrences of a particular value or range of values in a dataset. In the context of the histogram, the height of each bar indicates the frequency of quarters that fall within the corresponding weight interval. Understanding frequency is essential for interpreting the data distribution and answering questions about sample size.
Recommended video:
 04:41
04:41Creating Frequency Polygons
Sample Size
Sample size is the number of observations or data points collected in a study or experiment. In this question, determining the sample size involves summing the frequencies of the three bars on the left side of the histogram, which represent the weights of quarters in the lower range. Knowing the sample size is crucial for statistical analysis and drawing conclusions from the data.
Recommended video:
 05:11
05:11Sampling Distribution of Sample Proportion

Related Videos
Related Practice

