2. Describing Data with Tables and Graphs
Visualizing Qualitative vs. Quantitative Data
Problem 2.4.10
Textbook Question
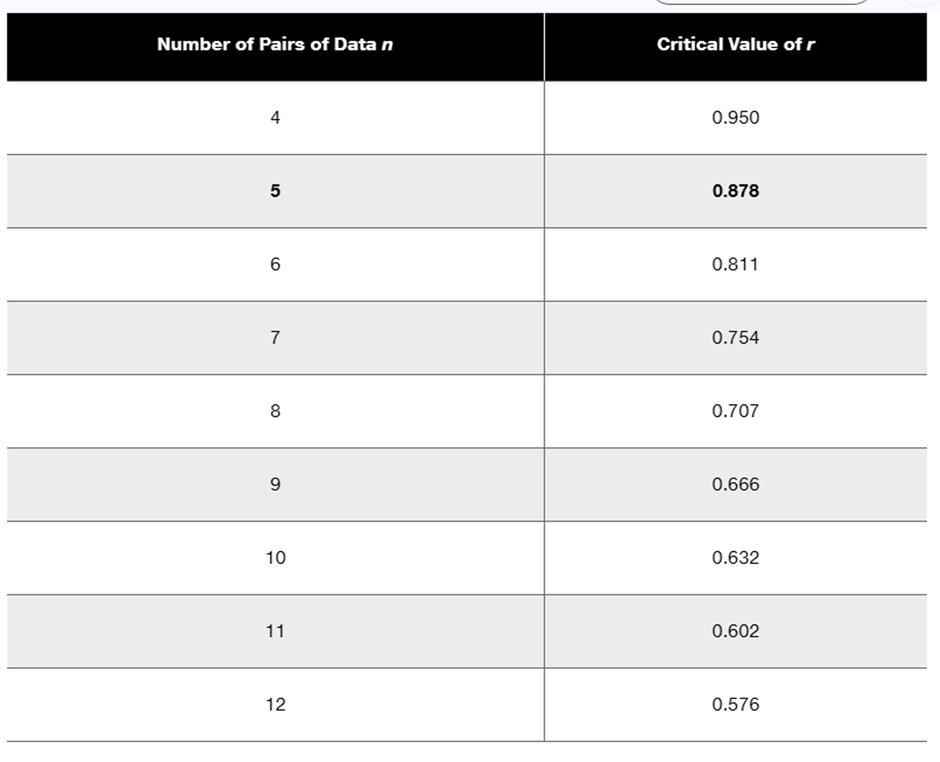
Use Table 2-11 to find the critical values of r. Based on a comparison of the linear correlation coefficient r and the critical values, what do you conclude about a linear correlation?
Using the data from Exercise 6 “Airport Data Speeds,” the linear correlation coefficient is r = 0.866

 Verified step by step guidance
1
Step 1: Count the number of pairs of data (n) in the dataset provided. Each pair consists of one value from Sprint and one value from Verizon. In the table, there are 8 pairs of data.
Step 2: Refer to Table 2-11 to find the critical value of r for n = 8. From the table, the critical value of r for n = 8 is 0.707.
Step 3: Compare the given linear correlation coefficient r = 0.866 with the critical value of r = 0.707. If the absolute value of r is greater than the critical value, there is significant evidence of a linear correlation.
Step 4: Since r = 0.866 is greater than the critical value of 0.707, conclude that there is a significant linear correlation between the Sprint and Verizon data speeds.
Step 5: Interpret the result: The significant linear correlation suggests that as one variable (e.g., Sprint data speed) increases, the other variable (e.g., Verizon data speed) tends to increase as well, indicating a positive relationship.
Verified video answer for a similar problem:This video solution was recommended by our tutors as helpful for the problem above
Video duration:
3mWas this helpful?

 4:39m
4:39mWatch next
Master Visualizing Qualitative vs. Quantitative Data with a bite sized video explanation from Patrick
Start learning


