6. Normal Distribution and Continuous Random Variables
Standard Normal Distribution
Problem 5.1.14
Textbook Question
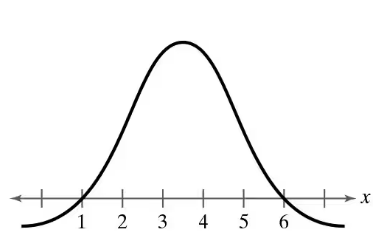
Graphical Analysis In Exercises 11–16, determine whether the graph could represent a variable with a normal distribution. Explain your reasoning. If the graph appears to represent a normal distribution, estimate the mean and standard deviation.
 Verified step by step guidance
1
Step 1: Observe the graph and identify its shape. A normal distribution is characterized by a symmetric bell-shaped curve, where the highest point occurs at the mean, and the curve tapers off equally on both sides.
Step 2: Check for symmetry. In this graph, the curve appears symmetric about the center, which is a key feature of a normal distribution.
Step 3: Estimate the mean. The mean of a normal distribution corresponds to the center of the graph. Based on the x-axis, the peak of the curve is around x = 3. This suggests the mean is approximately 3.
Step 4: Estimate the standard deviation. The standard deviation can be approximated by observing the spread of the curve. For a normal distribution, about 68% of the data falls within one standard deviation from the mean. Here, the curve starts tapering off significantly around x = 2 and x = 4, suggesting a standard deviation of approximately 1.
Step 5: Conclude whether the graph represents a normal distribution. Since the graph is symmetric, bell-shaped, and has a single peak at the mean, it is reasonable to conclude that this graph could represent a variable with a normal distribution.
Verified video answer for a similar problem:This video solution was recommended by our tutors as helpful for the problem above
Video duration:
4mWas this helpful?
Key Concepts
Here are the essential concepts you must grasp in order to answer the question correctly.
Normal Distribution
A normal distribution is a continuous probability distribution characterized by its bell-shaped curve, symmetric about the mean. It is defined by two parameters: the mean (average) and the standard deviation (spread). In a normal distribution, approximately 68% of the data falls within one standard deviation of the mean, 95% within two, and 99.7% within three, making it a key concept in statistics for understanding data behavior.
Recommended video:

 06:23
06:23Using the Normal Distribution to Approximate Binomial Probabilities
Mean and Standard Deviation
The mean is the average value of a dataset, calculated by summing all values and dividing by the number of observations. The standard deviation measures the dispersion of data points around the mean, indicating how spread out the values are. In the context of a normal distribution, these two parameters help define the shape and position of the curve, allowing for predictions about the likelihood of various outcomes.
Recommended video:
Guided course
 08:45
08:45Calculating Standard Deviation
Graphical Analysis
Graphical analysis involves examining visual representations of data, such as histograms or density plots, to identify patterns, trends, and distributions. In the context of normal distributions, one looks for characteristics like symmetry, a single peak (unimodal), and tails that approach the horizontal axis without touching it. This analysis is crucial for determining whether a dataset can be modeled by a normal distribution and for estimating its parameters.
Recommended video:
 06:46
06:46Introduction to ANOVA
 9:47m
9:47mWatch next
Master Finding Standard Normal Probabilities using z-Table with a bite sized video explanation from Patrick
Start learning

