6. Normal Distribution and Continuous Random Variables
Standard Normal Distribution
Problem 3.CRE.7
Textbook Question
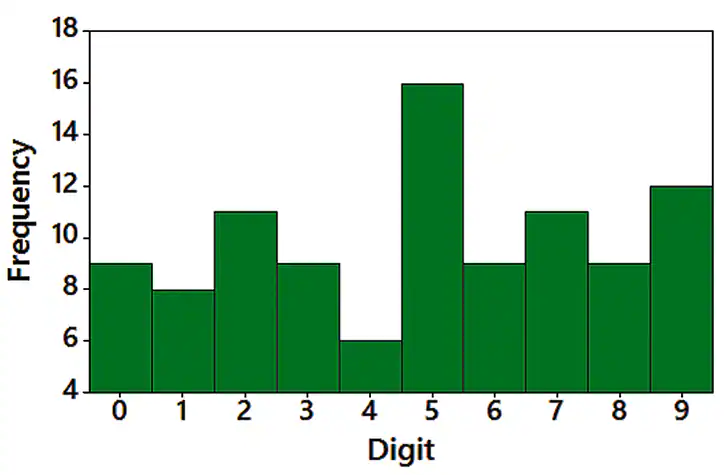
Normal Distribution Examine the distribution shown in the histogram from Exercise 6. Does it appear that the sample data are from a population with a normal distribution? Why or why not?
 Verified step by step guidance
1
Step 1: Observe the histogram provided. A normal distribution typically has a bell-shaped curve, where the frequencies are highest at the center and taper off symmetrically towards the tails. In this histogram, the frequencies do not follow this pattern.
Step 2: Note the peaks and troughs in the histogram. For a normal distribution, the frequencies should gradually decrease as you move away from the center. However, the histogram shows irregular peaks, such as the high frequency at digit 5 and lower frequencies at digits 3 and 4.
Step 3: Assess the symmetry of the distribution. A normal distribution is symmetric around its mean. In this histogram, the frequencies are not symmetric; for example, the frequencies for digits 0, 1, and 2 differ significantly from those for digits 7, 8, and 9.
Step 4: Consider the spread of the data. A normal distribution has a smooth, continuous spread. The histogram here shows a jagged pattern with abrupt changes in frequency, which is inconsistent with a normal distribution.
Step 5: Conclude based on the observations. The irregular shape, lack of symmetry, and uneven spread of frequencies suggest that the sample data are not from a population with a normal distribution.
Verified video answer for a similar problem:This video solution was recommended by our tutors as helpful for the problem above
Video duration:
2mWas this helpful?

 9:47m
9:47mWatch next
Master Finding Standard Normal Probabilities using z-Table with a bite sized video explanation from Patrick
Start learning


