6. Normal Distribution and Continuous Random Variables
Standard Normal Distribution
Problem 6.1.10
Textbook Question
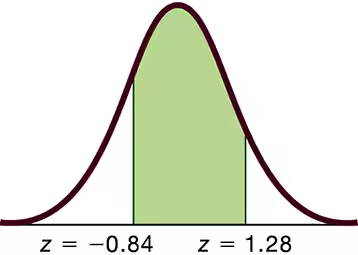
Standard Normal Distribution. In Exercises 9–12, find the area of the shaded region. The graph depicts the standard normal distribution of bone density scores with mean 0 and standard deviation 1.
 Verified step by step guidance
1
Step 1: Understand the problem. The graph represents a standard normal distribution with a mean of 0 and a standard deviation of 1. The shaded region corresponds to the area between z = -0.84 and z = 1.28. We need to calculate this area.
Step 2: Recall that the area under the standard normal curve represents probabilities. To find the area between two z-scores, we calculate the cumulative probability for each z-score using the standard normal table or a statistical software.
Step 3: Look up the cumulative probability for z = -0.84 in the standard normal table. This gives the area to the left of z = -0.84.
Step 4: Look up the cumulative probability for z = 1.28 in the standard normal table. This gives the area to the left of z = 1.28.
Step 5: Subtract the cumulative probability for z = -0.84 from the cumulative probability for z = 1.28. This difference represents the area of the shaded region between the two z-scores.
Verified video answer for a similar problem:This video solution was recommended by our tutors as helpful for the problem above
Video duration:
3mWas this helpful?
Key Concepts
Here are the essential concepts you must grasp in order to answer the question correctly.
Standard Normal Distribution
The standard normal distribution is a special case of the normal distribution where the mean is 0 and the standard deviation is 1. It is represented by the bell-shaped curve, which is symmetric about the mean. This distribution is crucial for statistical analysis as it allows for the calculation of probabilities and the use of z-scores to determine how far a data point is from the mean in terms of standard deviations.
Recommended video:
Guided course

 09:47
09:47Finding Standard Normal Probabilities using z-Table
Z-scores
A z-score indicates how many standard deviations an element is from the mean of a distribution. It is calculated by subtracting the mean from the value and then dividing by the standard deviation. In the context of the standard normal distribution, z-scores help in identifying the position of a score relative to the mean, allowing for the determination of probabilities associated with specific ranges of data.
Recommended video:
Guided course
 06:31
06:31Z-Scores From Given Probability - TI-84 (CE) Calculator
Area under the Curve
The area under the curve of a probability distribution represents the total probability of all outcomes. For the standard normal distribution, the area between two z-scores corresponds to the probability of a score falling within that range. This area can be found using z-tables or statistical software, and it is essential for answering questions related to probabilities and confidence intervals in statistics.
Recommended video:
Guided course
 08:50
08:50Z-Scores from Probabilities
 9:47m
9:47mWatch next
Master Finding Standard Normal Probabilities using z-Table with a bite sized video explanation from Patrick
Start learning
