1. Intro to Stats and Collecting Data
Intro to Stats
Problem 1.1.21
Textbook Question
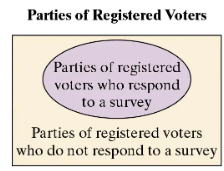
Use the Venn diagram to identify the population and the sample.
 Verified step by step guidance
1
Step 1: Understand the definitions of population and sample. The population refers to the entire group of individuals or items being studied, while the sample is a subset of the population that is selected for analysis.
Step 2: Analyze the Venn diagram. The diagram shows two groups: 'Parties of registered voters who respond to a survey' (inside the oval) and 'Parties of registered voters who do not respond to a survey' (outside the oval).
Step 3: Identify the population. The population in this context is all registered voters, as the study is concerned with the parties of all registered voters, regardless of whether they respond to the survey or not.
Step 4: Identify the sample. The sample is the subset of registered voters who respond to the survey, as they are the ones whose data is being collected and analyzed.
Step 5: Conclude that the population encompasses both groups shown in the diagram, while the sample is specifically the group within the oval (respondents).
Verified video answer for a similar problem:This video solution was recommended by our tutors as helpful for the problem above
Video duration:
2mWas this helpful?
Key Concepts
Here are the essential concepts you must grasp in order to answer the question correctly.
Population
In statistics, the population refers to the entire group of individuals or instances about which we seek to draw conclusions. In the context of the Venn diagram, the population consists of all registered voters, encompassing both those who respond to the survey and those who do not.
Recommended video:

 04:48
04:48Population Standard Deviation Known
Sample
A sample is a subset of the population that is selected for analysis. In the Venn diagram, the sample is represented by the group of registered voters who respond to the survey. This smaller group is used to make inferences about the larger population.
Recommended video:
 05:11
05:11Sampling Distribution of Sample Proportion
Venn Diagram
A Venn diagram is a visual tool used to illustrate the relationships between different sets. In this case, it helps to distinguish between the total population of registered voters and the sample of those who participated in the survey, highlighting the overlap and differences between the two groups.
Recommended video:
 5:14
5:14Probability of Mutually Exclusive Events
 2:13m
2:13mWatch next
Master Introduction to Statistics Channel with a bite sized video explanation from Patrick
Start learning

