Table of contents
- 1. Intro to Stats and Collecting Data55m
- 2. Describing Data with Tables and Graphs1h 55m
- 3. Describing Data Numerically1h 45m
- 4. Probability2h 16m
- 5. Binomial Distribution & Discrete Random Variables2h 33m
- 6. Normal Distribution and Continuous Random Variables1h 38m
- 7. Sampling Distributions & Confidence Intervals: Mean1h 3m
- 8. Sampling Distributions & Confidence Intervals: Proportion1h 12m
- 9. Hypothesis Testing for One Sample1h 1m
- 10. Hypothesis Testing for Two Samples2h 8m
- 11. Correlation48m
- 12. Regression1h 4m
- 13. Chi-Square Tests & Goodness of Fit1h 20m
- 14. ANOVA1h 0m
1. Intro to Stats and Collecting Data
Intro to Stats
Problem 1.1.24
Textbook Question
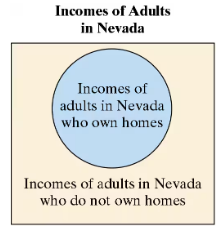
Use the Venn diagram to identify the population and the sample.

 Verified step by step guidance
1
Step 1: Understand the concept of population and sample. In statistics, the population refers to the entire group of individuals or items that we are interested in studying, while the sample is a subset of the population that is selected for analysis.
Step 2: Analyze the Venn diagram. The diagram shows two groups: 'Incomes of adults in Nevada who own homes' (inside the blue circle) and 'Incomes of adults in Nevada who do not own homes' (outside the blue circle but within the larger rectangle).
Step 3: Identify the population. The population in this case is represented by the larger rectangle, which includes all adults in Nevada regardless of whether they own homes or not. This is the entire group being studied.
Step 4: Identify the sample. The sample is represented by the blue circle, which includes only the incomes of adults in Nevada who own homes. This is the subset of the population being analyzed.
Step 5: Relate the population and sample. The sample is a specific part of the population, and conclusions drawn from the sample can be used to infer characteristics about the population, provided the sample is representative.
 Verified video answer for a similar problem:
This video solution was recommended by our tutors as helpful for the problem above
Video duration:
1mPlay a video:
Was this helpful?
Key Concepts
Here are the essential concepts you must grasp in order to answer the question correctly.
Population
In statistics, the population refers to the entire group of individuals or items that share a common characteristic. In the context of the Venn diagram, the population consists of all adults in Nevada, encompassing both homeowners and non-homeowners. Understanding the population is crucial for making generalizations and drawing conclusions from a sample.
Recommended video:

Population Standard Deviation Known
Sample
A sample is a subset of the population selected for analysis, intended to represent the larger group. In the Venn diagram, the sample could be the incomes of a specific group of adults in Nevada who own homes or do not own homes. Analyzing a sample allows researchers to make inferences about the population without needing to study every individual.
Recommended video:

Sampling Distribution of Sample Proportion
Venn Diagram
A Venn diagram is a visual tool used to illustrate the relationships between different sets. In this case, it shows the overlap between the incomes of adults in Nevada who own homes and those who do not. This representation helps clarify how the sample and population are related, making it easier to identify which groups are included in the analysis.
Recommended video:

Probability of Mutually Exclusive Events

 2:13m
2:13mWatch next
Master Introduction to Statistics Channel with a bite sized video explanation from Patrick
Start learning


