4. Probability
Addition Rule
Problem 3.RE.13
Textbook Question
In Exercises 13 and 14, use the table, which shows the approximate distribution of the sizes of firms for a recent year. (Adapted from North American Industry Classification System)
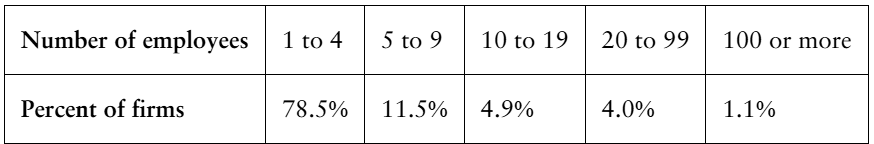
13. Find the probability that a randomly selected firm will have more than four employees.
 Verified video answer for a similar problem:
This video solution was recommended by our tutors as helpful for the problem above
Video duration:
1mWas this helpful?
Key Concepts
Here are the essential concepts you must grasp in order to answer the question correctly.
Probability
Probability is a measure of the likelihood that a particular event will occur, expressed as a number between 0 and 1. In this context, it refers to the chance of randomly selecting a firm with more than four employees from the given distribution. Understanding how to calculate probability is essential for interpreting statistical data and making informed decisions based on that data.
Recommended video:

 5:37
5:37Introduction to Probability
Cumulative Distribution
A cumulative distribution function (CDF) represents the probability that a random variable takes on a value less than or equal to a certain number. To find the probability of selecting a firm with more than four employees, one must calculate the cumulative percentage of firms with four or fewer employees and subtract it from 100%. This concept is crucial for understanding how probabilities accumulate across different categories.
Recommended video:
Guided course
 06:38
06:38Intro to Frequency Distributions
Percentages in Statistics
Percentages are a way to express a number as a fraction of 100, making it easier to compare different data sets. In the context of the table, the percentages represent the proportion of firms within specific employee ranges. Understanding how to interpret and manipulate these percentages is vital for answering questions about distributions and probabilities in statistics.
Recommended video:
Guided course
 05:53
05:53Parameters vs. Statistics
 5:14m
5:14mWatch next
Master Probability of Mutually Exclusive Events with a bite sized video explanation from Patrick
Start learning

