2. Describing Data with Tables and Graphs
Histograms
Problem 2.1.23b
Textbook Question
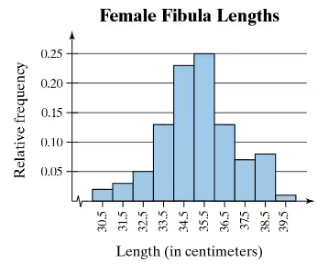
Use the relative frequency histogram to
approximate the greatest and least relative frequencies.
 Verified step by step guidance
1
Step 1: Observe the relative frequency histogram provided. The x-axis represents the length of female fibulas in centimeters, while the y-axis represents the relative frequency.
Step 2: Identify the bar with the greatest height on the histogram. The height of the bar corresponds to the greatest relative frequency. Approximate the value by observing the y-axis scale.
Step 3: Identify the bar with the smallest height on the histogram. The height of the bar corresponds to the least relative frequency. Approximate the value by observing the y-axis scale.
Step 4: Note the range of lengths (x-axis) associated with the bars of greatest and least relative frequencies. This provides additional context for the data distribution.
Step 5: Summarize the findings by stating the approximate greatest and least relative frequencies based on the histogram and their corresponding length ranges.
Verified video answer for a similar problem:This video solution was recommended by our tutors as helpful for the problem above
Video duration:
1mWas this helpful?


Related Videos
Related Practice


