2. Describing Data with Tables and Graphs
Frequency Distributions
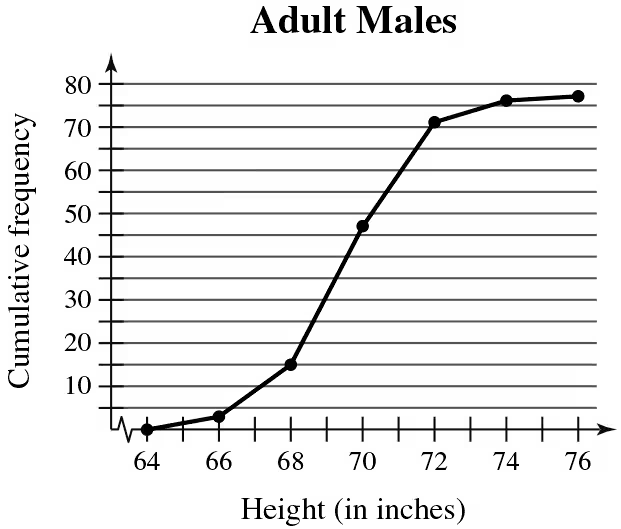
Problem 2.1.28b
Textbook Question
Use the ogive to approximate
the height for which the cumulative frequency is 15.
 Verified step by step guidance
1
Step 1: Understand the ogive graph. An ogive is a cumulative frequency graph that shows the cumulative frequency of data points up to a certain value. The x-axis represents the height (in inches), and the y-axis represents the cumulative frequency.
Step 2: Locate the cumulative frequency of 15 on the y-axis. This is the target value for which we need to approximate the corresponding height.
Step 3: Draw a horizontal line from the cumulative frequency value of 15 on the y-axis until it intersects the ogive curve.
Step 4: From the point of intersection, draw a vertical line down to the x-axis. This will give the approximate height corresponding to the cumulative frequency of 15.
Step 5: Read the value on the x-axis where the vertical line meets it. This is the approximate height for which the cumulative frequency is 15.
Verified video answer for a similar problem:This video solution was recommended by our tutors as helpful for the problem above
Video duration:
1mWas this helpful?

 6:38m
6:38mWatch next
Master Intro to Frequency Distributions with a bite sized video explanation from Patrick
Start learningRelated Videos
Related Practice


