6. Normal Distribution and Continuous Random Variables
Standard Normal Distribution
Problem 2.2.19a
Textbook Question
Interpreting Normal Quantile Plots Which of the following normal quantile plots appear to represent data from a population having a normal distribution? Explain.
a. 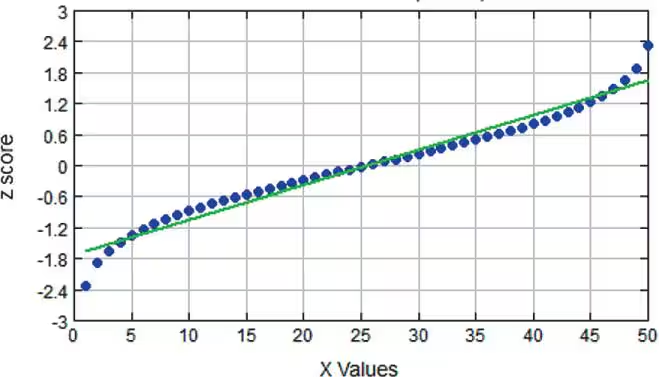
 Verified video answer for a similar problem:
This video solution was recommended by our tutors as helpful for the problem above
Video duration:
1mWas this helpful?
Key Concepts
Here are the essential concepts you must grasp in order to answer the question correctly.
Normal Distribution
A normal distribution is a continuous probability distribution characterized by its bell-shaped curve, defined by its mean and standard deviation. In a normal distribution, data points are symmetrically distributed around the mean, with most observations clustering near the center and fewer observations appearing as you move away from the mean. Understanding this concept is crucial for interpreting normal quantile plots, as deviations from this shape indicate non-normality.
Recommended video:
Guided course

 09:47
09:47Finding Standard Normal Probabilities using z-Table
Quantile Plot
A quantile plot, specifically a normal quantile plot, is a graphical tool used to assess if a dataset follows a normal distribution. It plots the quantiles of the dataset against the quantiles of a standard normal distribution. If the points in the plot closely follow a straight line, it suggests that the data is normally distributed; deviations from this line indicate departures from normality.
Recommended video:
 04:01
04:01Creating Dotplots
Z-scores
Z-scores are standardized scores that indicate how many standard deviations an element is from the mean of the dataset. In the context of normal quantile plots, z-scores are used to transform the data points so that they can be compared to the standard normal distribution. This transformation is essential for determining how well the data fits a normal distribution, as it allows for a direct comparison of the data's distribution to the theoretical normal distribution.
Recommended video:
Guided course
 06:31
06:31Z-Scores From Given Probability - TI-84 (CE) Calculator
 9:47m
9:47mWatch next
Master Finding Standard Normal Probabilities using z-Table with a bite sized video explanation from Patrick
Start learning

