Table of contents
- 1. Intro to Stats and Collecting Data55m
- 2. Describing Data with Tables and Graphs1h 55m
- 3. Describing Data Numerically1h 45m
- 4. Probability2h 16m
- 5. Binomial Distribution & Discrete Random Variables2h 33m
- 6. Normal Distribution and Continuous Random Variables1h 38m
- 7. Sampling Distributions & Confidence Intervals: Mean1h 3m
- 8. Sampling Distributions & Confidence Intervals: Proportion1h 12m
- 9. Hypothesis Testing for One Sample1h 1m
- 10. Hypothesis Testing for Two Samples2h 8m
- 11. Correlation48m
- 12. Regression1h 4m
- 13. Chi-Square Tests & Goodness of Fit1h 20m
- 14. ANOVA1h 0m
6. Normal Distribution and Continuous Random Variables
Standard Normal Distribution
Problem 36c
Textbook Question
Water Taxi Safety When a water taxi sank in Baltimore’s Inner Harbor, an investigation revealed that the safe passenger load for the water taxi was 3500 lb. It was also noted that the mean weight of a passenger was assumed to be 140 lb. Assume a “worst-case” scenario in which all of the passengers are adult men. Assume that weights of men are normally distributed with a mean of 188.6 lb and a standard deviation of 38.9 lb (based on Data Set 1 “Body Data” in Appendix B).
c. With a load limit of 3500 lb, how many male passengers are allowed if we assume the updated mean weight of 188.6 lb?
 Verified step by step guidance
1
Step 1: Define the problem. We need to determine the maximum number of male passengers allowed on the water taxi, given the total weight limit of 3500 lb and the updated mean weight of 188.6 lb per passenger. The weights of male passengers are normally distributed with a mean (μ) of 188.6 lb and a standard deviation (σ) of 38.9 lb.
Step 2: Calculate the total weight of n passengers. The total weight is given by the formula: Total Weight = n √ó Mean Weight. Here, n represents the number of passengers, and the Mean Weight is 188.6 lb.
Step 3: Set up the inequality for the weight limit. To ensure the total weight does not exceed the limit, we use the inequality: n × 188.6 ≤ 3500. Solve this inequality for n to find the maximum number of passengers allowed.
Step 4: Round down the result. Since the number of passengers must be a whole number, round down the value of n obtained from the inequality to ensure the total weight remains within the limit.
Step 5: Verify the result. Multiply the rounded value of n by the mean weight (188.6 lb) to confirm that the total weight does not exceed 3500 lb. This ensures the solution is valid and adheres to the safety guidelines.
 Verified video answer for a similar problem:
This video solution was recommended by our tutors as helpful for the problem above
Video duration:
1mPlay a video:
Was this helpful?
Key Concepts
Here are the essential concepts you must grasp in order to answer the question correctly.
Normal Distribution
Normal distribution is a probability distribution that is symmetric about the mean, showing that data near the mean are more frequent in occurrence than data far from the mean. In this context, the weights of adult men are normally distributed, which allows us to use statistical methods to estimate probabilities and make inferences about the population based on the mean and standard deviation.
Recommended video:
Guided course

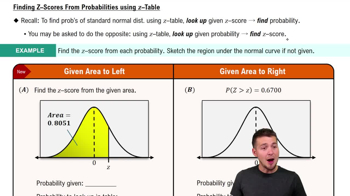
Finding Standard Normal Probabilities using z-Table
Mean and Standard Deviation
The mean is the average of a set of values, while the standard deviation measures the amount of variation or dispersion in a set of values. In this scenario, the mean weight of adult men is 188.6 lb, and the standard deviation is 38.9 lb, which helps us understand the typical weight of passengers and how much individual weights may vary from this average.
Recommended video:
Guided course

Calculating Standard Deviation
Load Limit Calculation
The load limit calculation involves determining how many passengers can be safely accommodated without exceeding the maximum weight capacity. Given the load limit of 3500 lb and the mean weight of 188.6 lb per male passenger, this calculation is essential to ensure safety and compliance with regulations, allowing us to find the maximum number of passengers that can be safely transported.
Recommended video:
Guided course

Calculating Correlation Coefficient - Graphing Calculator

 9:47m
9:47mWatch next
Master Finding Standard Normal Probabilities using z-Table with a bite sized video explanation from Patrick
Start learning


