3. Describing Data Numerically
Standard Deviation
Problem 2.4.45
Textbook Question
Comparing Variation in Different Data Sets In Exercises 45–50, find the coefficient of variation for each of the two data sets. Then compare the results.
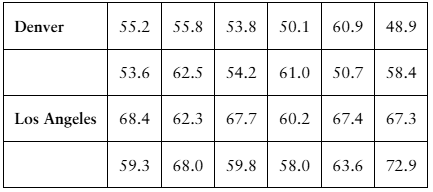
Annual Salaries Sample annual salaries (in thousands of dollars) for entry level architects in Denver, CO, and Los Angeles, CA, are listed.
 Verified step by step guidance
1
Step 1: Understand the coefficient of variation (CV). The CV is a measure of relative variability and is calculated as the ratio of the standard deviation (SD) to the mean (μ), expressed as a percentage: CV = (SD / μ) × 100.
Step 2: Calculate the mean (μ) for each data set. Add all the values in the Denver data set and divide by the number of values to find the mean for Denver. Repeat the process for the Los Angeles data set.
Step 3: Calculate the standard deviation (SD) for each data set. Use the formula for SD: SD = sqrt(Σ(xᵢ - μ)² / (n - 1)), where xᵢ represents each data point, μ is the mean, and n is the number of data points. Perform this calculation for both Denver and Los Angeles data sets.
Step 4: Compute the coefficient of variation (CV) for each data set using the formula CV = (SD / μ) × 100. Substitute the mean and standard deviation values calculated in the previous steps for both Denver and Los Angeles.
Step 5: Compare the CVs of the two data sets. The data set with the higher CV has greater relative variability in annual salaries.
Verified video answer for a similar problem:This video solution was recommended by our tutors as helpful for the problem above
Video duration:
9mWas this helpful?
Key Concepts
Here are the essential concepts you must grasp in order to answer the question correctly.
Coefficient of Variation
The coefficient of variation (CV) is a statistical measure of the relative variability of a data set. It is calculated as the ratio of the standard deviation to the mean, expressed as a percentage. A higher CV indicates greater dispersion relative to the mean, making it useful for comparing the degree of variation between different data sets, especially when the means are significantly different.
Recommended video:
Guided course

 06:14
06:14Coefficient of Determination
Standard Deviation
Standard deviation is a measure of the amount of variation or dispersion in a set of values. It quantifies how much the individual data points deviate from the mean of the data set. A low standard deviation indicates that the data points tend to be close to the mean, while a high standard deviation indicates that the data points are spread out over a wider range of values.
Recommended video:
Guided course
 08:45
08:45Calculating Standard Deviation
Mean
The mean, or average, is a measure of central tendency that is calculated by summing all the values in a data set and dividing by the number of values. It provides a single value that represents the center of the data distribution. The mean is sensitive to extreme values (outliers), which can skew the results, making it important to consider alongside other measures of central tendency and variability.
Recommended video:
Guided course
 04:52
04:52Calculating the Mean
 8:45m
8:45mWatch next
Master Calculating Standard Deviation with a bite sized video explanation from Patrick
Start learningRelated Videos
Related Practice
