3. Describing Data Numerically
Standard Deviation
Problem 2.4.48
Textbook Question
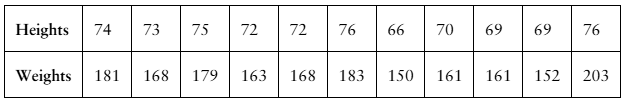
Comparing Variation in Different Data Sets In Exercises 45ŌĆō50, find the coefficient of variation for each of the two data sets. Then compare the results.
Heights and Weights The heights (in inches) and weights (in pounds) of every France national soccer team player that started the 2018 FIFA MenŌĆÖs World Cup final are listed. (Source: ESPN)
 Verified step by step guidance
1
Step 1: Understand the coefficient of variation (CV). The CV is a measure of relative variability and is calculated as the ratio of the standard deviation (SD) to the mean (╬╝), expressed as a percentage: CV = (SD / ╬╝) ├Ś 100.
Step 2: Calculate the mean (╬╝) for each data set. For the heights, sum all the values and divide by the number of players. Repeat the same process for the weights.
Step 3: Calculate the standard deviation (SD) for each data set. Use the formula: SD = sqrt(╬Ż(xi - ╬╝)^2 / n), where xi represents each individual value, ╬╝ is the mean, and n is the number of values in the data set.
Step 4: Compute the coefficient of variation (CV) for each data set using the formula CV = (SD / ╬╝) ├Ś 100. Perform this calculation separately for the heights and weights.
Step 5: Compare the CVs of the two data sets. A higher CV indicates greater relative variability in the data set. Discuss the implications of the comparison in terms of the variability of heights versus weights.
Verified video answer for a similar problem:This video solution was recommended by our tutors as helpful for the problem above
Video duration:
12mWas this helpful?

 8:45m
8:45mWatch next
Master Calculating Standard Deviation with a bite sized video explanation from Patrick
Start learningRelated Videos
Related Practice

