Table of contents
- 1. Intro to Stats and Collecting Data55m
- 2. Describing Data with Tables and Graphs1h 55m
- 3. Describing Data Numerically1h 45m
- 4. Probability2h 16m
- 5. Binomial Distribution & Discrete Random Variables2h 33m
- 6. Normal Distribution and Continuous Random Variables1h 38m
- 7. Sampling Distributions & Confidence Intervals: Mean1h 3m
- 8. Sampling Distributions & Confidence Intervals: Proportion1h 12m
- 9. Hypothesis Testing for One Sample1h 1m
- 10. Hypothesis Testing for Two Samples2h 8m
- 11. Correlation48m
- 12. Regression1h 4m
- 13. Chi-Square Tests & Goodness of Fit1h 20m
- 14. ANOVA1h 0m
6. Normal Distribution and Continuous Random Variables
Standard Normal Distribution
Problem 6.4.15d
Textbook Question
Ergonomics. Exercises 9–16 involve applications to ergonomics, as described in the Chapter Problem.
Doorway Height The Boeing 757-200 ER airliner carries 200 passengers and has doors with a height of 72 in. Heights of men are normally distributed with a mean of 68.6 in. and a standard deviation of 2.8 in. (based on Data Set 1 “Body Data” in Appendix B).
d. When considering the comfort and safety of passengers, why are women ignored in this case?
 Verified step by step guidance
1
Step 1: Understand the context of the problem. The problem is about doorway height in a Boeing 757-200 ER airliner and how it relates to the heights of passengers. The focus is on men’s heights, which are normally distributed with a mean of 68.6 inches and a standard deviation of 2.8 inches.
Step 2: Recognize the statistical reasoning behind ignoring women in this case. The problem specifically mentions men’s heights, so we need to consider why women’s heights are excluded. This could be due to the fact that men, on average, are taller than women, and the doorway height of 72 inches is more likely to pose a challenge for taller individuals.
Step 3: Recall that the normal distribution is used to model the heights of men. The mean (68.6 inches) and standard deviation (2.8 inches) provide a way to calculate probabilities or proportions of men who might find the doorway height uncomfortable or unsafe.
Step 4: Consider the practical implications. Since men are generally taller than women, the likelihood of a man hitting his head on the doorway is higher than that of a woman. Therefore, focusing on men’s heights ensures that the doorway accommodates the tallest group of passengers effectively.
Step 5: Conclude that women are ignored in this case because their average height is significantly lower than men’s, making it less likely for them to encounter issues with the doorway height. This allows the analysis to focus on the group most at risk of discomfort or safety concerns.
 Verified video answer for a similar problem:
This video solution was recommended by our tutors as helpful for the problem above
Video duration:
4mPlay a video:
Was this helpful?
Key Concepts
Here are the essential concepts you must grasp in order to answer the question correctly.
Normal Distribution
Normal distribution is a probability distribution that is symmetric about the mean, indicating that data near the mean are more frequent in occurrence than data far from the mean. In this context, men's heights are normally distributed, which allows for statistical analysis of how many men would fit comfortably through a doorway of a given height.
Recommended video:
Guided course

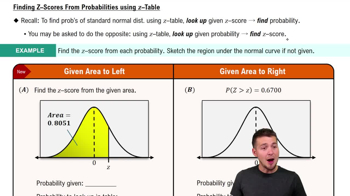
Finding Standard Normal Probabilities using z-Table
Mean and Standard Deviation
The mean is the average value of a data set, while the standard deviation measures the amount of variation or dispersion from the mean. In this scenario, the mean height of men is 68.6 inches with a standard deviation of 2.8 inches, which helps in understanding the range of heights that can be expected among the male passengers.
Recommended video:
Guided course

Calculating Standard Deviation
Ergonomics and Gender Considerations
Ergonomics is the study of people's efficiency in their working environment, often focusing on design that accommodates the physical characteristics of users. In this case, the question raises a critical point about gender considerations in design, as ignoring women's heights may lead to safety and comfort issues for a significant portion of the population, highlighting the importance of inclusive design.

 9:47m
9:47mWatch next
Master Finding Standard Normal Probabilities using z-Table with a bite sized video explanation from Patrick
Start learning


