Table of contents
- 1. Intro to Stats and Collecting Data55m
- 2. Describing Data with Tables and Graphs1h 55m
- 3. Describing Data Numerically1h 45m
- 4. Probability2h 16m
- 5. Binomial Distribution & Discrete Random Variables2h 33m
- 6. Normal Distribution and Continuous Random Variables1h 38m
- 7. Sampling Distributions & Confidence Intervals: Mean1h 3m
- 8. Sampling Distributions & Confidence Intervals: Proportion1h 12m
- 9. Hypothesis Testing for One Sample1h 1m
- 10. Hypothesis Testing for Two Samples2h 8m
- 11. Correlation48m
- 12. Regression1h 4m
- 13. Chi-Square Tests & Goodness of Fit1h 20m
- 14. ANOVA1h 0m
6. Normal Distribution and Continuous Random Variables
Standard Normal Distribution
Problem 6.4.16a
Textbook Question
Ergonomics. Exercises 9ŌĆō16 involve applications to ergonomics, as described in the Chapter Problem.
Aircraft Cockpit The overhead panel in an aircraft cockpit typically includes controls for such features as landing lights, fuel booster pumps, and oxygen. It is important for pilots to be able to reach those overhead controls while sitting. Seated adult males have overhead grip reaches that are normally distributed with a mean of 51.6 in. and a standard deviation of 2.2 in.
a. If an aircraft is designed for pilots with an overhead grip reach of 53 in., what percentage of adult males would not be able to reach the overhead controls? Is that percentage too high?
 Verified step by step guidance
1
Step 1: Identify the key parameters of the normal distribution. The problem states that the overhead grip reaches are normally distributed with a mean (╬╝) of 51.6 inches and a standard deviation (Žā) of 2.2 inches. The threshold value for the overhead grip reach is 53 inches.
Step 2: Standardize the threshold value using the z-score formula. The z-score formula is given by: , where x is the threshold value (53 inches), ╬╝ is the mean (51.6 inches), and Žā is the standard deviation (2.2 inches). Substitute the values into the formula to calculate the z-score.
Step 3: Use the z-score to find the cumulative probability. Once the z-score is calculated, use a standard normal distribution table or a statistical software to find the cumulative probability corresponding to the z-score. This cumulative probability represents the proportion of adult males who can reach the overhead controls.
Step 4: Subtract the cumulative probability from 1 to find the percentage of adult males who cannot reach the overhead controls. The formula is: , where P is the percentage of males who cannot reach, and C is the cumulative probability from Step 3.
Step 5: Evaluate whether the percentage of males who cannot reach the controls is too high. Compare the result from Step 4 to a reasonable threshold (e.g., 5% or 10%) to determine if the design is acceptable or if adjustments are needed to accommodate more pilots.
 Verified video answer for a similar problem:
This video solution was recommended by our tutors as helpful for the problem above
Video duration:
3mPlay a video:
Was this helpful?
Key Concepts
Here are the essential concepts you must grasp in order to answer the question correctly.
Normal Distribution
Normal distribution is a probability distribution that is symmetric about the mean, indicating that data near the mean are more frequent in occurrence than data far from the mean. In this context, the overhead grip reaches of seated adult males follow a normal distribution, characterized by a mean (average) and a standard deviation (spread). Understanding this concept is crucial for determining the percentage of the population that falls above or below a certain reach.
Recommended video:
Guided course

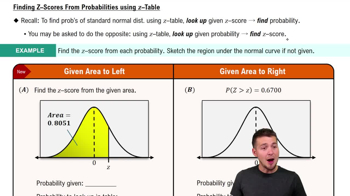
Finding Standard Normal Probabilities using z-Table
Z-Score
A Z-score is a statistical measurement that describes a value's relationship to the mean of a group of values. It is calculated by subtracting the mean from the value and then dividing by the standard deviation. In this scenario, calculating the Z-score for a grip reach of 53 inches will help determine how many standard deviations this value is from the mean, allowing us to find the corresponding percentile in the normal distribution.
Recommended video:
Guided course

Z-Scores From Given Probability - TI-84 (CE) Calculator
Percentile
A percentile is a measure used in statistics indicating the value below which a given percentage of observations fall. For example, if a certain grip reach is at the 75th percentile, it means that 75% of the population has a grip reach less than that value. In this question, calculating the percentile for the grip reach of 53 inches will help assess how many adult males would be unable to reach the overhead controls, informing whether the design is suitable for the intended user population.

 9:47m
9:47mWatch next
Master Finding Standard Normal Probabilities using z-Table with a bite sized video explanation from Patrick
Start learning


