4. Probability
Basic Concepts of Probability
Problem 3.1.77
Textbook Question
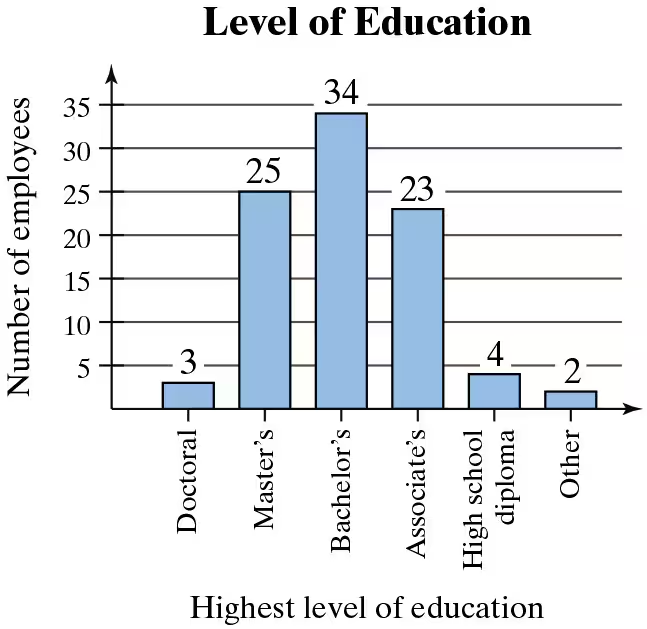
Using a Bar Graph to Find Probabilities In Exercises 75-78, use the bar graph at the left, which shows the highest level of education received by employees of a company. Find the probability that the highest level of education for an employee chosen at random is
77. a master's degree.
 Verified step by step guidance
1
Step 1: Identify the total number of employees in the company by summing the frequencies of all education levels shown in the bar graph. Add the values: 3 (Doctoral) + 25 (Master's) + 34 (Bachelor's) + 23 (Associate's) + 4 (High school diploma) + 2 (Other).
Step 2: Determine the number of employees whose highest level of education is a master's degree. From the bar graph, this value is 25.
Step 3: Calculate the probability of randomly selecting an employee whose highest level of education is a master's degree. Use the formula for probability: \( P = \frac{\text{Number of favorable outcomes}}{\text{Total number of outcomes}} \). Substitute the values: \( P = \frac{25}{\text{Total number of employees}} \).
Step 4: Simplify the fraction obtained in Step 3, if necessary, to express the probability in its simplest form.
Step 5: Interpret the result as the likelihood of randomly selecting an employee with a master's degree, ensuring the probability is expressed as a fraction, decimal, or percentage depending on the context.
Verified video answer for a similar problem:This video solution was recommended by our tutors as helpful for the problem above
Video duration:
1mWas this helpful?

 5:37m
5:37mWatch next
Master Introduction to Probability with a bite sized video explanation from Patrick
Start learningRelated Videos
Related Practice
