3. Describing Data Numerically
Mean
Problem 14.q.8
Textbook Question
In Exercises 5ŌĆō8, use the following two control charts that result from testing batches of newly manufactured aircraft altimeters, with 100 in each batch. The original sample values are errors (in feet) obtained when the altimeters are tested in a pressure chamber that simulates an altitude of 6000 ft. The Federal Aviation Administration requires an error of no more than 40 ft at that altitude.
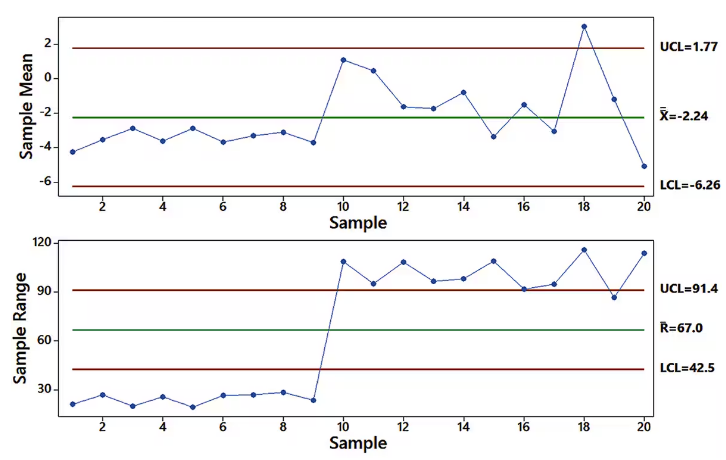
What is the value of x_double bar In general, how is a value of xbar found?
 Verified step by step guidance
1
Step 1: Understand the term x̄ (x_double bar). It represents the overall mean of the sample means from all batches. In control charts, x̄ is calculated by averaging the sample means plotted on the chart.
Step 2: Locate the value of x̄ on the control chart. In the provided Sample Mean chart, x̄ is explicitly labeled as -2.24. This is the overall mean of the sample means.
Step 3: To calculate x̄ manually, sum all the individual sample means (the y-values of the points on the Sample Mean chart) and divide by the total number of samples. Use the formula: , where n is the number of samples.
Step 4: Understand how a value of x̄ (sample mean for a single batch) is found. For each batch, the sample mean is calculated by summing all the individual errors in the batch and dividing by the number of errors (100 in this case). The formula is: , where xi represents individual error values and n is the batch size.
Step 5: Verify that the calculated x̄ values for each batch are plotted correctly on the Sample Mean chart. These values are used to monitor whether the process is within control limits (UCL and LCL).
Verified video answer for a similar problem:This video solution was recommended by our tutors as helpful for the problem above
Video duration:
1mWas this helpful?
Key Concepts
Here are the essential concepts you must grasp in order to answer the question correctly.
Control Charts
Control charts are graphical tools used to monitor the stability of a process over time. They display data points in time order and include control limits that indicate the expected variation in the process. In this context, the control charts for sample mean and range help assess whether the altimeter manufacturing process is in control and meets the FAA's error requirements.
Recommended video:

 06:10
06:10Creating Pie Charts
Sample Mean (x̄)
The sample mean, denoted as x̄, is the average of a set of sample values. It is calculated by summing all the sample values and dividing by the number of samples. In the context of the question, finding the value of x̄ involves analyzing the errors from the altimeter tests to determine the average error, which is crucial for evaluating compliance with the FAA standards.
Recommended video:
 05:11
05:11Sampling Distribution of Sample Proportion
Upper and Lower Control Limits (UCL and LCL)
Upper Control Limit (UCL) and Lower Control Limit (LCL) are thresholds set on control charts to determine the acceptable range of variation in a process. If sample means fall outside these limits, it indicates that the process may be out of control. In this scenario, the UCL and LCL for the sample mean and range help identify whether the altimeter errors are within acceptable limits as per regulatory requirements.
Recommended video:
Guided course
 06:29
06:29How to Create Frequency Distributions
 4:52m
4:52mWatch next
Master Calculating the Mean with a bite sized video explanation from Patrick
Start learningRelated Videos
Related Practice


