3. Describing Data Numerically
Mean
Problem 10.q.9
Textbook Question
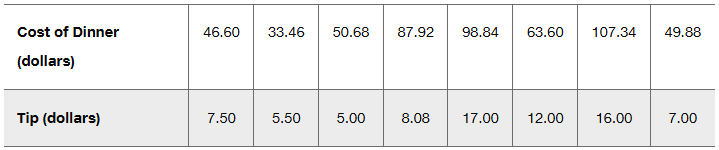
Exercises 1ŌĆō10 are based on the following sample data consisting of costs of dinner (dollars) and the amounts of tips (dollars) left by diners. The data were collected by students of the author.
Predictions Repeat the preceding exercise assuming that the linear correlation coefficient is r = 0.132.
 Verified step by step guidance
1
Step 1: Understand the problem. The goal is to analyze the relationship between the cost of dinner and the tip amount using the given data, assuming the linear correlation coefficient r = 0.132. This indicates a weak positive linear relationship between the two variables.
Step 2: Organize the data. The table provides pairs of values for the cost of dinner (independent variable, x) and the tip amount (dependent variable, y). These pairs will be used to calculate predictions based on the weak correlation.
Step 3: Use the formula for the equation of a regression line: y = mx + b, where m is the slope and b is the y-intercept. The slope m can be calculated using the formula: m = r * (sy / sx), where sy is the standard deviation of the tip amounts and sx is the standard deviation of the dinner costs.
Step 4: Calculate the y-intercept b using the formula: b = ȳ - m * x̄, where ȳ is the mean of the tip amounts and x̄ is the mean of the dinner costs. This will allow you to complete the regression equation.
Step 5: Use the regression equation to make predictions for the tip amounts based on the given dinner costs. Substitute each dinner cost into the equation y = mx + b to estimate the corresponding tip amount.
Verified video answer for a similar problem:This video solution was recommended by our tutors as helpful for the problem above
Video duration:
1mWas this helpful?
Key Concepts
Here are the essential concepts you must grasp in order to answer the question correctly.
Linear Correlation Coefficient (r)
The linear correlation coefficient, denoted as 'r', quantifies the strength and direction of a linear relationship between two variables. Its value ranges from -1 to 1, where 1 indicates a perfect positive correlation, -1 indicates a perfect negative correlation, and 0 indicates no correlation. In this context, an r value of 0.132 suggests a weak positive correlation between the cost of dinner and the amount of tip left.
Recommended video:
Guided course

 05:43
05:43Correlation Coefficient
Scatter Plot
A scatter plot is a graphical representation that displays the relationship between two quantitative variables. Each point on the plot corresponds to an observation in the dataset, with one variable plotted along the x-axis and the other along the y-axis. Analyzing the scatter plot can help visualize the correlation and identify any trends or patterns in the data, which is essential for interpreting the correlation coefficient.
Recommended video:
 04:01
04:01Creating Dotplots
Regression Analysis
Regression analysis is a statistical method used to model the relationship between a dependent variable and one or more independent variables. In this case, it could be used to predict the amount of tip based on the cost of dinner. The results of regression analysis can provide insights into how changes in the cost of dinner might affect the tips, allowing for better predictions and understanding of the data.
 4:52m
4:52mWatch next
Master Calculating the Mean with a bite sized video explanation from Patrick
Start learningRelated Videos
Related Practice


