6. Normal Distribution and Continuous Random Variables
Probabilities & Z-Scores w/ Graphing Calculator
Problem 6.2.21
Textbook Question
Pulse Rates. In Exercises 13–24, use the data in the table below for pulse rates of adult males and females (based on Data Set 1 “Body Data” in Appendix B). Hint: Draw a graph in each case.
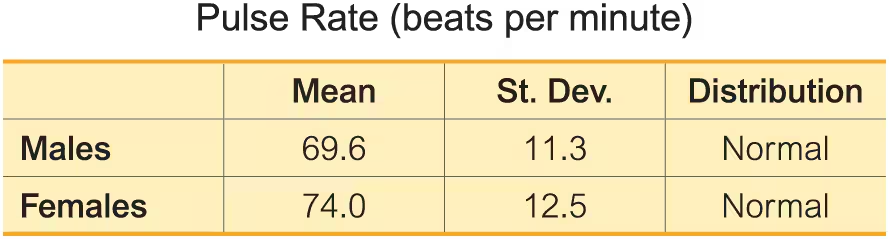
For males, find P90 which is the pulse rate separating the bottom 90% from the top 10%.
 Verified video answer for a similar problem:
This video solution was recommended by our tutors as helpful for the problem above
Video duration:
4mWas this helpful?
Key Concepts
Here are the essential concepts you must grasp in order to answer the question correctly.
Percentiles
A percentile is a measure used in statistics to indicate the value below which a given percentage of observations fall. For example, P90 (the 90th percentile) is the value below which 90% of the data points lie. Understanding percentiles is crucial for interpreting data distributions and making comparisons between different datasets.
Normal Distribution
Normal distribution is a probability distribution that is symmetric about the mean, showing that data near the mean are more frequent in occurrence than data far from the mean. It is characterized by its bell-shaped curve and is defined by two parameters: the mean and the standard deviation. Many statistical methods assume normality, making it essential for analyzing data sets.
Recommended video:
Guided course

 09:47
09:47Finding Standard Normal Probabilities using z-Table
Standard Deviation
Standard deviation is a statistic that measures the dispersion or variability of a dataset relative to its mean. A low standard deviation indicates that the data points tend to be close to the mean, while a high standard deviation indicates a wider spread. It is a key concept in understanding the distribution of data and is used in calculating percentiles.
Recommended video:
Guided course
 08:45
08:45Calculating Standard Deviation
 7:09m
7:09mWatch next
Master Probability From Given Z-Scores - TI-84 (CE) Calculator with a bite sized video explanation from Patrick
Start learningRelated Videos
Related Practice

