4. Probability
Basic Concepts of Probability
Problem 3.1.87a
Textbook Question
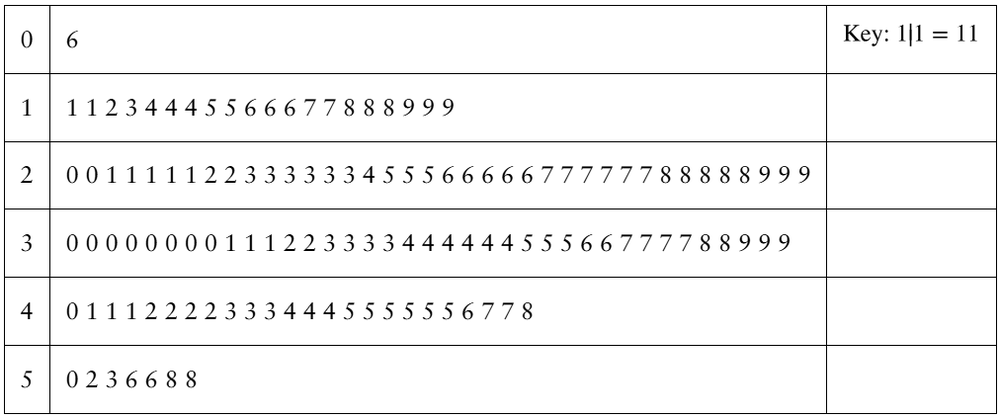
87. College Football A stem-and-leaf plot for the numbers of touchdowns allowed by the 127 NCAA Division I Football Bowl Subdivision teams in the 2020-2021 season is shown. Find the probability that a team chosen at random allowed (a) at least 51 touchdowns. Are any of these events unusual? Explain. (Source: National Collegiate Athletic Association)
 Verified video answer for a similar problem:
This video solution was recommended by our tutors as helpful for the problem above
Video duration:
4mWas this helpful?
Key Concepts
Here are the essential concepts you must grasp in order to answer the question correctly.
Stem-and-Leaf Plot
A stem-and-leaf plot is a graphical representation used to display quantitative data in a way that retains the original data values while showing their distribution. Each number is split into a 'stem' (the leading digit or digits) and a 'leaf' (the trailing digit). This format allows for easy visualization of the data's shape and helps identify the frequency of values within specific ranges.
Recommended video:

 04:59
04:59Creating Stemplots
Probability
Probability is a measure of the likelihood that a particular event will occur, expressed as a number between 0 and 1. In this context, it involves calculating the proportion of teams that allowed at least 51 touchdowns out of the total number of teams. Understanding how to compute probabilities is essential for making inferences about data and assessing the likelihood of various outcomes.
Recommended video:
 5:37
5:37Introduction to Probability
Unusual Events
An event is considered unusual if its probability is significantly low, often defined as less than 5%. In the context of this question, determining whether the event of a team allowing at least 51 touchdowns is unusual involves calculating its probability and comparing it to this threshold. This concept helps in understanding the rarity of certain outcomes within a dataset.
Recommended video:
 05:54
05:54Probability of Multiple Independent Events
 5:37m
5:37mWatch next
Master Introduction to Probability with a bite sized video explanation from Patrick
Start learningRelated Videos
Related Practice