2. Describing Data with Tables and Graphs
Histograms
Problem 10.5.4
Textbook Question
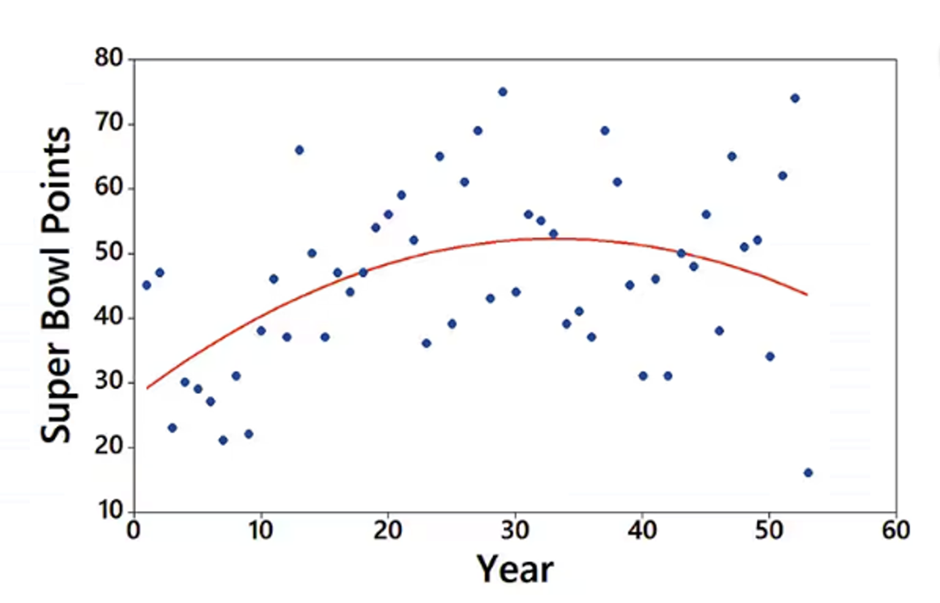
Interpreting a Graph The accompanying graph plots the numbers of points scored in each Super Bowl from the first Super Bowl in 1967 (coded as year 1) to the last Super Bowl at the time of this writing. The graph of the quadratic equation that best fits the data is also shown in red. What feature of the graph justifies the value of R^2 = 0.205 for the quadratic model?
 Verified step by step guidance
1
Step 1: Understand the value of R^2. The R^2 value, also known as the coefficient of determination, measures how well the quadratic model (red curve) explains the variability in the data points (blue dots). A value of R^2 = 0.205 indicates that only 20.5% of the variability in the data is explained by the quadratic model.
Step 2: Observe the graph. The blue dots represent the actual points scored in each Super Bowl, while the red curve represents the quadratic model that best fits the data. Notice that the data points are widely scattered around the red curve, indicating a weak fit.
Step 3: Analyze the scatter of data points. The large spread of the blue dots around the red curve suggests that the quadratic model does not closely follow the actual data. This lack of closeness justifies the relatively low R^2 value.
Step 4: Consider alternative models. The low R^2 value implies that the quadratic model may not be the best choice for explaining the data. A different model, such as a linear or higher-order polynomial, might provide a better fit.
Step 5: Relate the graph to the R^2 value. The feature of the graph that justifies the R^2 value is the significant deviation of the blue dots from the red curve, which shows that the quadratic model captures only a small portion of the variability in the data.
Verified video answer for a similar problem:This video solution was recommended by our tutors as helpful for the problem above
Video duration:
2mWas this helpful?


Related Videos
Related Practice


