Table of contents
- 1. Intro to Stats and Collecting Data55m
- 2. Describing Data with Tables and Graphs1h 55m
- 3. Describing Data Numerically1h 45m
- 4. Probability2h 16m
- 5. Binomial Distribution & Discrete Random Variables2h 33m
- 6. Normal Distribution and Continuous Random Variables1h 38m
- 7. Sampling Distributions & Confidence Intervals: Mean1h 3m
- 8. Sampling Distributions & Confidence Intervals: Proportion1h 12m
- 9. Hypothesis Testing for One Sample1h 1m
- 10. Hypothesis Testing for Two Samples2h 8m
- 11. Correlation48m
- 12. Regression1h 4m
- 13. Chi-Square Tests & Goodness of Fit1h 20m
- 14. ANOVA1h 0m
8. Sampling Distributions & Confidence Intervals: Proportion
Confidence Intervals for Population Proportion
Struggling with Statistics?
Join thousands of students who trust us to help them ace their exams!Watch the first videoMultiple Choice
A previous study found that your school consists of 60% White/Caucasian students. You want the 98% confidence interval for the proportion of White/Caucasian students to be no more than .05 away from the true proportion. How many students must you include in a sample to create this confidence interval?
A
520
B
519
C
542
D
260
 Verified step by step guidance
1
Step 1: Understand the problem requirements. We need to find the sample size required to achieve a 98% confidence interval with a margin of error of 0.05 for the proportion of White/Caucasian students, given that the proportion is 0.60.
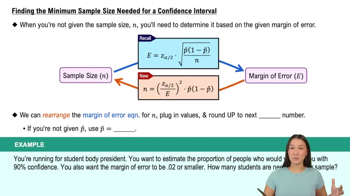
Step 2: Recall the formula for the margin of error in a proportion confidence interval: \( ME = z \times \sqrt{\frac{p(1-p)}{n}} \), where \( ME \) is the margin of error, \( z \) is the z-score corresponding to the confidence level, \( p \) is the estimated proportion, and \( n \) is the sample size.
Step 3: Determine the z-score for a 98% confidence level. The z-score for 98% confidence is approximately 2.33. This value can be found using a standard normal distribution table or calculator.
Step 4: Set up the equation using the margin of error formula: \( 0.05 = 2.33 \times \sqrt{\frac{0.60 \times (1 - 0.60)}{n}} \). Solve this equation for \( n \) to find the required sample size.
Step 5: Rearrange the equation to solve for \( n \): \( n = \frac{(2.33)^2 \times 0.60 \times 0.40}{(0.05)^2} \). Calculate \( n \) using this formula to determine the sample size needed.

 5:45m
5:45mWatch next
Master Constructing Confidence Intervals for Proportions with a bite sized video explanation from Patrick
Start learningRelated Videos
Related Practice


