1. Intro to Stats and Collecting Data
Intro to Stats
Problem 14.r.2
Textbook Question
Energy Consumption. Exercises 1–4 refer to the amounts of energy consumed in the author’s home. (Most of the data are real, but some are fabricated.) Each value represents energy consumed (kWh) in a two-month period. Let each subgroup consist of the six amounts within the same year. Data are available for download at www.TriolaStats.com.
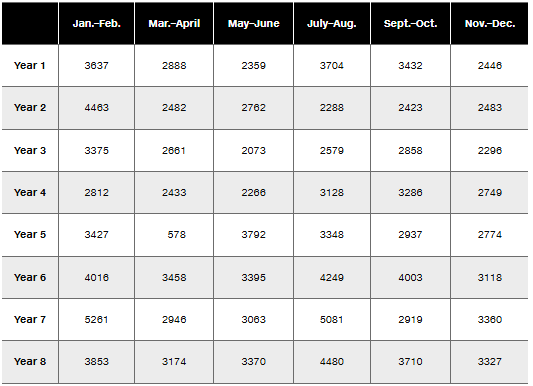
Energy Consumption: R Chart Let each subgroup consist of the 6 values within a year. Construct an R chart and determine whether the process variation is within statistical control. If it is not, identify which of the three out-of-control criteria lead to rejection of statistically stable variation.
 Verified step by step guidance
1
Step 1: Understand the problem. An R chart is used to monitor the range of variation within subgroups over time. Here, each subgroup consists of the six energy consumption values within a year. The goal is to determine if the process variation is within statistical control and identify any out-of-control criteria if applicable.
Step 2: Calculate the range for each subgroup (year). The range is the difference between the maximum and minimum values within each subgroup. For example, for Year 1, subtract the smallest value (2446) from the largest value (3704). Repeat this for all years.
Step 3: Compute the average range (RÃÑ) across all subgroups. Add up all the ranges calculated in Step 2 and divide by the number of subgroups (8 years). This average range will be used to calculate control limits.
Step 4: Determine the control limits for the R chart. Use the formulas for the upper control limit (UCL) and lower control limit (LCL): UCL = D4 * RÃÑ and LCL = D3 * RÃÑ, where D4 and D3 are constants based on the subgroup size (n=6). Look up the values of D4 and D3 in a standard statistical table for control charts.
Step 5: Plot the ranges for each year on the R chart and compare them to the control limits. If any range falls outside the control limits, the process variation is not within statistical control. Additionally, check for patterns or trends that might indicate instability, such as consecutive points near the control limits or a systematic increase/decrease in range values.
Verified video answer for a similar problem:This video solution was recommended by our tutors as helpful for the problem above
Video duration:
6mWas this helpful?
Key Concepts
Here are the essential concepts you must grasp in order to answer the question correctly.
R Chart
An R chart, or range chart, is a type of control chart used in statistical process control to monitor the variability of a process over time. It displays the range of values within subgroups, helping to identify whether the process variation is consistent or if there are signs of instability. By analyzing the R chart, one can determine if the process is in statistical control, which is crucial for maintaining quality in production.
Recommended video:

 06:10
06:10Creating Pie Charts
Statistical Control
Statistical control refers to a state in which a process operates consistently within predetermined limits, indicating that any variation is due to common causes rather than special causes. A process in statistical control is predictable and stable, allowing for effective monitoring and improvement. Identifying whether a process is in control is essential for quality management and ensuring that outputs meet desired specifications.
Recommended video:
Guided course
 05:53
05:53Parameters vs. Statistics
Out-of-Control Criteria
Out-of-control criteria are specific rules used to determine when a process is exhibiting unusual variation that may indicate a problem. Common criteria include points falling outside control limits, runs of consecutive points above or below the mean, or trends in the data. Recognizing these criteria is vital for taking corrective actions to bring the process back into control and ensuring consistent quality in production.
Recommended video:
Guided course
 07:09
07:09Intro to Random Variables & Probability Distributions
 2:13m
2:13mWatch next
Master Introduction to Statistics Channel with a bite sized video explanation from Patrick
Start learning
