1. Intro to Stats and Collecting Data
Intro to Stats
Problem 14.CQQ.10
Textbook Question
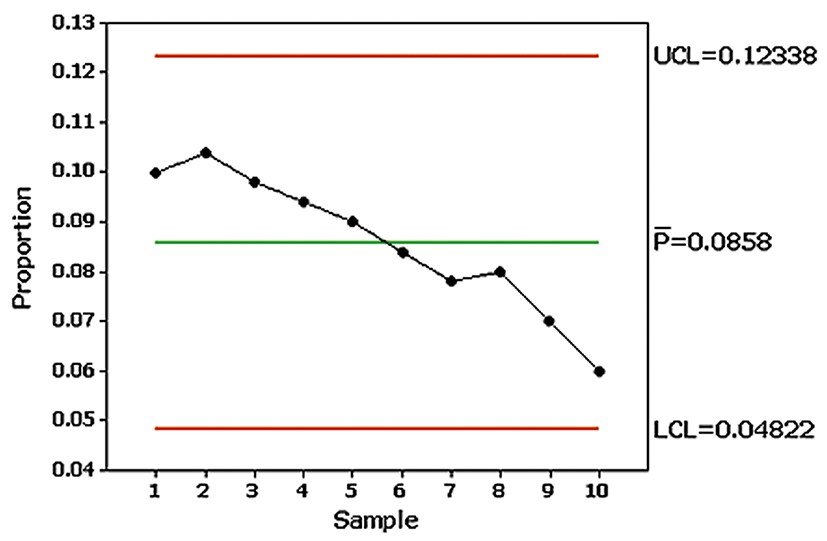
Examine the following p chart for defective calculator batteries and briefly describe the action that should be taken.
 Verified step by step guidance
1
Step 1: Understand the p chart. A p chart is used to monitor the proportion of defective items in a process over time. The chart includes a center line (mean proportion, \( \bar{p} \)), an upper control limit (UCL), and a lower control limit (LCL). Points outside these limits indicate that the process may be out of control.
Step 2: Analyze the data points. Observe the plotted proportions for each sample. In this chart, the proportions are consistently decreasing over time, but all points remain within the control limits (UCL = 0.12338 and LCL = 0.04822).
Step 3: Interpret the trend. Although the process is statistically in control (no points outside the control limits), the downward trend suggests a systematic improvement in the proportion of defective batteries. This could indicate positive changes in the process or quality control measures.
Step 4: Consider action based on the trend. Since the process is improving, no immediate corrective action is needed. However, it is important to monitor the process to ensure the trend continues and does not reverse or lead to instability.
Step 5: Document findings and maintain vigilance. Record the observed trend and any changes made to the process that may have contributed to the improvement. Continue monitoring the p chart to ensure the process remains stable and in control.
Verified video answer for a similar problem:This video solution was recommended by our tutors as helpful for the problem above
Video duration:
4mWas this helpful?

 2:13m
2:13mWatch next
Master Introduction to Statistics Channel with a bite sized video explanation from Patrick
Start learning

