Table of contents
- 1. Intro to Stats and Collecting Data55m
- 2. Describing Data with Tables and Graphs1h 55m
- 3. Describing Data Numerically1h 45m
- 4. Probability2h 16m
- 5. Binomial Distribution & Discrete Random Variables2h 33m
- 6. Normal Distribution and Continuous Random Variables1h 38m
- 7. Sampling Distributions & Confidence Intervals: Mean1h 3m
- 8. Sampling Distributions & Confidence Intervals: Proportion1h 12m
- 9. Hypothesis Testing for One Sample1h 1m
- 10. Hypothesis Testing for Two Samples2h 8m
- 11. Correlation48m
- 12. Regression1h 4m
- 13. Chi-Square Tests & Goodness of Fit1h 20m
- 14. ANOVA1h 0m
2. Describing Data with Tables and Graphs
Histograms
Problem 2.1.19a
Textbook Question
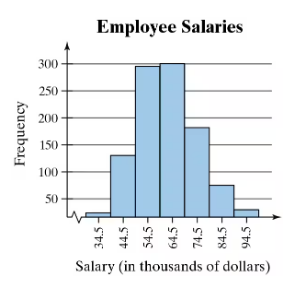
Use the frequency histogram
a. to determine the number of classes.

 Verified step by step guidance
1
Step 1: Observe the histogram provided. A histogram is a graphical representation of the distribution of data using bars, where each bar represents a class interval and its height corresponds to the frequency of data within that interval.
Step 2: Identify the class intervals on the x-axis. In this histogram, the intervals are labeled as 34.5-44.5, 44.5-54.5, 54.5-64.5, 64.5-74.5, 74.5-84.5, and 84.5-94.5.
Step 3: Count the number of distinct class intervals. Each interval represents a class, and the total number of intervals gives the number of classes.
Step 4: Verify that the intervals are non-overlapping and cover the entire range of the data. This ensures that the histogram is properly constructed and the number of classes is accurate.
Step 5: Conclude the number of classes based on the count from Step 3. In this case, there are six distinct class intervals visible in the histogram.
 Verified video answer for a similar problem:
This video solution was recommended by our tutors as helpful for the problem above
Video duration:
1mPlay a video:
Was this helpful?
Key Concepts
Here are the essential concepts you must grasp in order to answer the question correctly.
Frequency Histogram
A frequency histogram is a graphical representation of the distribution of numerical data. It displays the frequency of data points within specified intervals, known as bins or classes. Each bar's height corresponds to the number of observations in that interval, allowing for a visual interpretation of the data's distribution and central tendencies.
Recommended video:
Guided course

Intro to Histograms
Classes (Bins)
In the context of a histogram, classes (or bins) are the intervals into which the data is divided. The choice of the number of classes can affect the histogram's appearance and the insights drawn from it. A well-chosen number of classes helps to reveal patterns in the data, such as peaks and gaps, while too few or too many can obscure important information.
Recommended video:
Guided course

Intro to Histograms
Determining the Number of Classes
Determining the number of classes for a histogram is crucial for effective data visualization. Common methods include Sturges' rule, which suggests using the formula k = 1 + 3.322 log(n), where k is the number of classes and n is the number of data points. This approach helps balance detail and clarity, ensuring that the histogram accurately represents the data's distribution.
Recommended video:
Guided course

Coefficient of Determination
Related Videos
Related Practice


