4. Probability
Multiplication Rule: Independent Events
Problem 4.2.18
Textbook Question
In Exercises 9–20, use the data in the following table, which lists survey results from high school drivers at least 16 years of age (based on data from “Texting While Driving and Other Risky Motor Vehicle Behaviors Among U.S. High School Students,” by O’Malley, Shults, and Eaton, Pediatrics, Vol. 131, No. 6). Assume that subjects are randomly selected from those included in the table. Hint: Be very careful to read the question correctly.
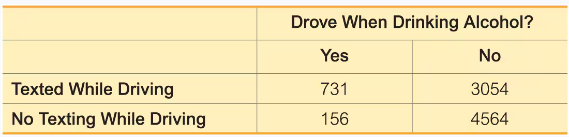
Texting and Alcohol If one of the high school drivers is randomly selected, find the probability that the selected driver did not text while driving and did not drive when drinking.
 Verified step by step guidance
1
Step 1: Identify the relevant data from the table. The problem asks for the probability that a randomly selected driver did not text while driving and did not drive when drinking. From the table, the number of drivers who meet this criterion is found in the 'No Texting While Driving' row and 'No' column, which is 4564.
Step 2: Calculate the total number of high school drivers surveyed. Add all the values in the table: 731 (Texted While Driving and Drove When Drinking) + 3054 (Texted While Driving and Did Not Drive When Drinking) + 156 (No Texting While Driving and Drove When Drinking) + 4564 (No Texting While Driving and Did Not Drive When Drinking).
Step 3: Use the formula for probability: \( P(A) = \frac{\text{Number of favorable outcomes}}{\text{Total number of outcomes}} \). Here, the favorable outcome is the number of drivers who did not text while driving and did not drive when drinking (4564), and the total number of outcomes is the total number of drivers surveyed (calculated in Step 2).
Step 4: Substitute the values into the probability formula. The numerator is 4564, and the denominator is the total number of drivers surveyed (calculated in Step 2).
Step 5: Simplify the fraction to express the probability. If needed, convert the fraction to a decimal or percentage for interpretation.
Verified video answer for a similar problem:This video solution was recommended by our tutors as helpful for the problem above
Video duration:
2mWas this helpful?
Key Concepts
Here are the essential concepts you must grasp in order to answer the question correctly.
Probability
Probability is a measure of the likelihood that a particular event will occur, expressed as a number between 0 and 1. In this context, it involves calculating the chance that a randomly selected high school driver did not text while driving and did not drive after drinking alcohol. This requires understanding how to use the total number of favorable outcomes relative to the total number of possible outcomes.
Recommended video:

 5:37
5:37Introduction to Probability
Contingency Table
A contingency table is a type of data representation that displays the frequency distribution of variables. In this case, the table shows the relationship between texting while driving and driving after drinking alcohol. Analyzing this table helps in determining the joint and marginal probabilities necessary for solving the problem.
Recommended video:
Guided course
 09:47
09:47Finding Standard Normal Probabilities using z-Table
Complementary Events
Complementary events are pairs of outcomes where one event occurs if and only if the other does not. In this scenario, the event of interest is that a driver did not text while driving and did not drive after drinking. Understanding complementary events is crucial for calculating the probability of the desired outcome by subtracting the probability of the opposite event from 1.
Recommended video:
 4:23
4:23Complementary Events
 5:54m
5:54mWatch next
Master Probability of Multiple Independent Events with a bite sized video explanation from Patrick
Start learningRelated Videos
Related Practice
