12. Regression
Residuals
Struggling with Statistics for Business?
Join thousands of students who trust us to help them ace their exams!Watch the first videoMultiple Choice
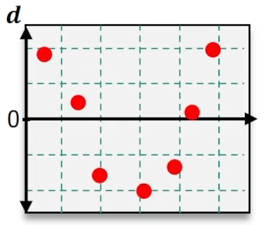
Which of the following residual plots suggest that a linear regression model is appropriate?
A
B

C

D

 Verified step by step guidance
1
Step 1: Understand the purpose of residual plots in regression analysis. Residual plots are used to assess whether the assumptions of a linear regression model are valid. Specifically, they help determine if the residuals (errors) are randomly distributed and if the relationship between the independent and dependent variables is linear.
Step 2: Examine the residual plots provided. A residual plot that suggests a linear regression model is appropriate will show residuals scattered randomly around the horizontal axis (y = 0) without any discernible pattern.
Step 3: Identify patterns in the residual plots. For example, if the residuals form a curve, trend, or systematic pattern, this indicates that a linear model may not be appropriate. If the residuals are randomly distributed, this supports the use of a linear model.
Step 4: Compare the residual plots. In the images provided, look for the plot where the residuals are evenly scattered around the horizontal axis without forming a trend or systematic pattern.
Step 5: Conclude which residual plot suggests a linear regression model is appropriate based on the analysis. The correct plot will show no curvature, trend, or clustering of residuals, indicating that the linear regression assumptions are satisfied.

 7:38m
7:38mWatch next
Master Residuals and Residual Plots with a bite sized video explanation from Patrick
Start learningRelated Videos

