3. Describing Data Numerically
Standard Deviation
Problem 10.3.4
Textbook Question
Standard Error of Estimate A random sample of 118 different female statistics students is obtained and their weights are measured in kilograms and in pounds. Using the 118 paired weights (weight in kg, weight in lb), what is the value of se? For a female statistics student who weighs 100 lb, the predicted weight in kilograms is 45.4 kg. What is the 95% prediction interval?
 Verified step by step guidance
1
Step 1: Understand the problem. The standard error of estimate (se) measures the accuracy of predictions made by a regression model. It is calculated using the residuals (differences between observed and predicted values). Additionally, the 95% prediction interval provides a range within which we expect the actual value to fall for a given prediction.
Step 2: Calculate the residuals. For each paired observation (weight in kg and weight in lb), subtract the predicted weight in kilograms from the observed weight in kilograms. Residual = Observed weight (kg) - Predicted weight (kg).
Step 3: Compute the standard error of estimate (se). Use the formula: , where n is the number of paired observations (118 in this case).
Step 4: Determine the 95% prediction interval. Use the formula: , where t is the critical value from the t-distribution for a 95% confidence level and degrees of freedom (df = n - 2). Look up the t-value corresponding to df = 116.
Step 5: Apply the prediction interval formula for the given prediction. Substitute the predicted weight in kilograms (45.4 kg), the calculated standard error of estimate (se), and the t-value into the formula to find the lower and upper bounds of the interval.
Verified video answer for a similar problem:This video solution was recommended by our tutors as helpful for the problem above
Video duration:
7mWas this helpful?
Key Concepts
Here are the essential concepts you must grasp in order to answer the question correctly.
Standard Error of Estimate (SE)
The Standard Error of Estimate quantifies the accuracy of predictions made by a regression model. It measures the average distance that the observed values fall from the regression line. A smaller SE indicates a better fit of the model to the data, meaning predictions are closer to actual values. In this context, it helps assess how well the weight in kilograms can be predicted from the weight in pounds.
Recommended video:
Guided course

 08:45
08:45Calculating Standard Deviation
Prediction Interval
A prediction interval provides a range within which we expect a future observation to fall, given a certain level of confidence (e.g., 95%). It accounts for both the uncertainty in the estimate of the mean response and the variability of individual observations. In this scenario, the prediction interval will help determine the range of weights in kilograms for a female statistics student weighing 100 lb, reflecting the inherent variability in the data.
Recommended video:
 06:33
06:33Introduction to Confidence Intervals
Linear Regression
Linear regression is a statistical method used to model the relationship between a dependent variable and one or more independent variables. It assumes a linear relationship, allowing us to predict the dependent variable based on the values of the independent variables. In this case, it is used to predict the weight in kilograms based on the weight in pounds, forming the basis for calculating the Standard Error of Estimate and the prediction interval.
Recommended video:
Guided course
 04:40
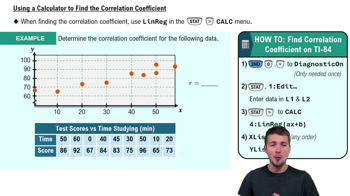
04:40Calculating Correlation Coefficient - Graphing Calculator
 8:45m
8:45mWatch next
Master Calculating Standard Deviation with a bite sized video explanation from Patrick
Start learningRelated Videos
Related Practice
