Table of contents
- 1. Intro to Stats and Collecting Data55m
- 2. Describing Data with Tables and Graphs1h 55m
- 3. Describing Data Numerically1h 45m
- 4. Probability2h 16m
- 5. Binomial Distribution & Discrete Random Variables2h 33m
- 6. Normal Distribution and Continuous Random Variables1h 38m
- 7. Sampling Distributions & Confidence Intervals: Mean1h 3m
- 8. Sampling Distributions & Confidence Intervals: Proportion1h 12m
- 9. Hypothesis Testing for One Sample1h 1m
- 10. Hypothesis Testing for Two Samples2h 8m
- 11. Correlation48m
- 12. Regression1h 4m
- 13. Chi-Square Tests & Goodness of Fit1h 20m
- 14. ANOVA1h 0m
6. Normal Distribution and Continuous Random Variables
Standard Normal Distribution
Problem 6.6.1a
Textbook Question
Continuity Correction In testing the assumption that the probability of a baby boy is 0.512, a geneticist obtains a random sample of 1000 births and finds that 502 of them are boys. Using the continuity correction, describe the area under the graph of a normal distribution corresponding to the following. (For example, the area corresponding to ÔÇťthe probability of at least 502 boysÔÇŁ is this: the area to the right of 501.5.)
a. The probability of 502 or fewer boys
 Verified step by step guidance
1
Step 1: Understand the problem. We are tasked with finding the probability of 502 or fewer boys in a sample of 1000 births, assuming the probability of a boy is 0.512. This involves using the normal approximation to the binomial distribution with a continuity correction.
Step 2: Calculate the mean (╬╝) and standard deviation (¤â) of the binomial distribution. The mean is given by ╬╝ = n * p, where n is the sample size (1000) and p is the probability of a boy (0.512). The standard deviation is given by ¤â = sqrt(n * p * (1 - p)).
Step 3: Apply the continuity correction. Since we are looking for the probability of 502 or fewer boys, we adjust the value to 502.5 to account for the discrete-to-continuous transition.
Step 4: Standardize the value using the z-score formula. The z-score is calculated as z = (X - ╬╝) / ¤â, where X is the adjusted value (502.5), ╬╝ is the mean, and ¤â is the standard deviation.
Step 5: Use the standard normal distribution table or a statistical software to find the cumulative probability corresponding to the calculated z-score. This cumulative probability represents the area under the normal curve to the left of 502.5, which is the probability of 502 or fewer boys.
 Verified video answer for a similar problem:
This video solution was recommended by our tutors as helpful for the problem above
Video duration:
1mPlay a video:
Was this helpful?
Key Concepts
Here are the essential concepts you must grasp in order to answer the question correctly.
Normal Distribution
The normal distribution is a continuous probability distribution characterized by its bell-shaped curve, defined by its mean and standard deviation. It is widely used in statistics because many real-world phenomena tend to follow this distribution. In hypothesis testing, the normal distribution helps to approximate the behavior of sample proportions, especially with large sample sizes, allowing for easier calculation of probabilities.
Recommended video:
Guided course

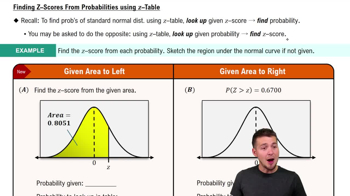
Finding Standard Normal Probabilities using z-Table
Continuity Correction
Continuity correction is a technique used when a discrete distribution is approximated by a continuous distribution, such as the normal distribution. It involves adjusting the discrete values by 0.5 to account for the fact that continuous distributions can take on any value within a range, while discrete distributions can only take specific values. This correction improves the accuracy of probability estimates, particularly in cases involving binomial distributions.
Recommended video:

Using the Normal Distribution to Approximate Binomial Probabilities
Cumulative Probability
Cumulative probability refers to the probability that a random variable takes on a value less than or equal to a specific value. In the context of the normal distribution, it is represented by the area under the curve to the left of a given point. For example, to find the probability of 502 or fewer boys, one would calculate the cumulative probability up to 501.5, which incorporates the continuity correction for more accurate results.
Recommended video:

Introduction to Probability

 9:47m
9:47mWatch next
Master Finding Standard Normal Probabilities using z-Table with a bite sized video explanation from Patrick
Start learning


