3. Describing Data Numerically
Mean
Problem 3.1.30
Textbook Question
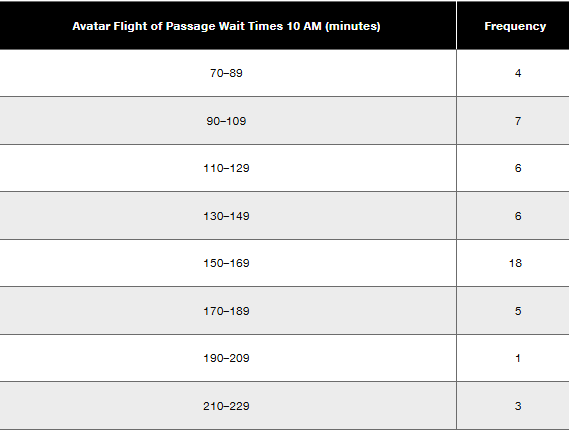
In Exercises 29–32, compute the mean of the data summarized in the frequency distribution. Also, compare the computed means to the actual means obtained by using the original list of data values, which are as follows: (29) 31.4 minutes; (Exercise 30) 140.6 minutes; (Exercise 31) 55.2 years; (Exercise 32) 240.2 seconds.
 Verified step by step guidance
1
Step 1: Identify the midpoint of each class interval. The midpoint is calculated as the average of the lower and upper boundaries of each interval. For example, for the interval 70–89, the midpoint is (70 + 89) / 2 = 79.5.
Step 2: Multiply the midpoint of each class interval by its corresponding frequency to find the weighted contribution of each interval. For example, for the interval 70–89, the weighted contribution is 79.5 × 4.
Step 3: Sum all the weighted contributions obtained in Step 2. This gives the total weighted sum of the data.
Step 4: Sum all the frequencies to find the total number of data points. For example, add 4 + 7 + 6 + 6 + 18 + 5 + 1 + 3.
Step 5: Divide the total weighted sum (from Step 3) by the total frequency (from Step 4) to compute the mean of the data summarized in the frequency distribution.
Verified video answer for a similar problem:This video solution was recommended by our tutors as helpful for the problem above
Video duration:
4mWas this helpful?
Key Concepts
Here are the essential concepts you must grasp in order to answer the question correctly.
Mean
The mean, or average, is a measure of central tendency calculated by summing all data values and dividing by the number of values. In the context of a frequency distribution, the mean can be computed by multiplying each midpoint of the class intervals by its corresponding frequency, summing these products, and then dividing by the total frequency. This provides a representative value of the dataset.
Recommended video:
Guided course

 04:52
04:52Calculating the Mean
Frequency Distribution
A frequency distribution is a summary of how often each value or range of values occurs in a dataset. It organizes data into classes or intervals, showing the number of observations (frequency) within each interval. This helps in visualizing the distribution of data and is essential for calculating measures like the mean, as it provides the necessary structure for analysis.
Recommended video:
Guided course
 06:38
06:38Intro to Frequency Distributions
Comparison of Means
Comparing the mean calculated from a frequency distribution to the mean derived from the original dataset allows for an assessment of accuracy and representation. Discrepancies between these means can indicate how well the frequency distribution captures the underlying data. This comparison is crucial for validating the results and understanding the potential impact of data summarization techniques.
Recommended video:
Guided course
04:52Calculating the Mean
 4:52m
4:52mWatch next
Master Calculating the Mean with a bite sized video explanation from Patrick
Start learningRelated Videos
Related Practice

