2. Describing Data with Tables and Graphs
Frequency Distributions
Problem 2.1.16
Textbook Question
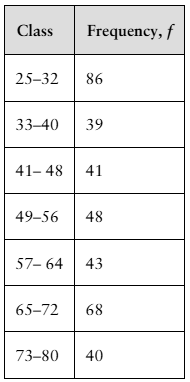
use the frequency distribution to find the (a) class width, (b) class midpoints, and (c) class boundaries.
Toledo, OH, Average Normal Temperatures (F)
 Verified step by step guidance
1
Step 1: To find the class width, subtract the lower boundary of the first class from the upper boundary of the first class. For example, for the class 25–32, the class width is calculated as 32 - 25.
Step 2: To find the class midpoints, calculate the average of the lower and upper boundaries for each class. For example, for the class 25–32, the midpoint is calculated as (25 + 32) / 2.
Step 3: To find the class boundaries, subtract 0.5 from the lower boundary and add 0.5 to the upper boundary for each class. For example, for the class 25–32, the boundaries are calculated as 24.5 and 32.5.
Step 4: Repeat the calculations for class width, midpoints, and boundaries for all other classes in the frequency distribution table.
Step 5: Organize the results into a table format for clarity, listing the class widths, midpoints, and boundaries for each class.
Verified video answer for a similar problem:This video solution was recommended by our tutors as helpful for the problem above
Video duration:
4mWas this helpful?
Key Concepts
Here are the essential concepts you must grasp in order to answer the question correctly.
Class Width
Class width is the difference between the upper and lower boundaries of a class interval in a frequency distribution. It helps in determining how data is grouped into intervals. For example, in the class interval 25-32, the class width is 32 - 25 = 7. Consistent class widths are essential for accurate data representation and analysis.
Recommended video:
Guided course

 05:18
05:18How to Create Frequency Distributions Example 2
Class Midpoint
The class midpoint is the value that lies in the middle of a class interval and is calculated by averaging the upper and lower boundaries of the class. For instance, for the class 25-32, the midpoint is (25 + 32) / 2 = 28.5. Midpoints are useful for summarizing data and performing further statistical calculations, such as finding the mean.
Recommended video:
 04:15
04:15Frequency Polygons Example 1
Class Boundaries
Class boundaries are the values that separate one class interval from another, ensuring there are no gaps between classes. They are typically calculated by taking the average of the upper limit of one class and the lower limit of the next. For example, the boundary between the classes 32 and 33 would be 32.5. Understanding class boundaries is crucial for accurate data analysis and representation.
Recommended video:
Guided course
 07:10
07:10How to Create Histogram - TI-84 Calculator
 6:38m
6:38mWatch next
Master Intro to Frequency Distributions with a bite sized video explanation from Patrick
Start learningRelated Videos
Related Practice


