5. Binomial Distribution & Discrete Random Variables
Discrete Random Variables
Problem 5.RE.8
Textbook Question
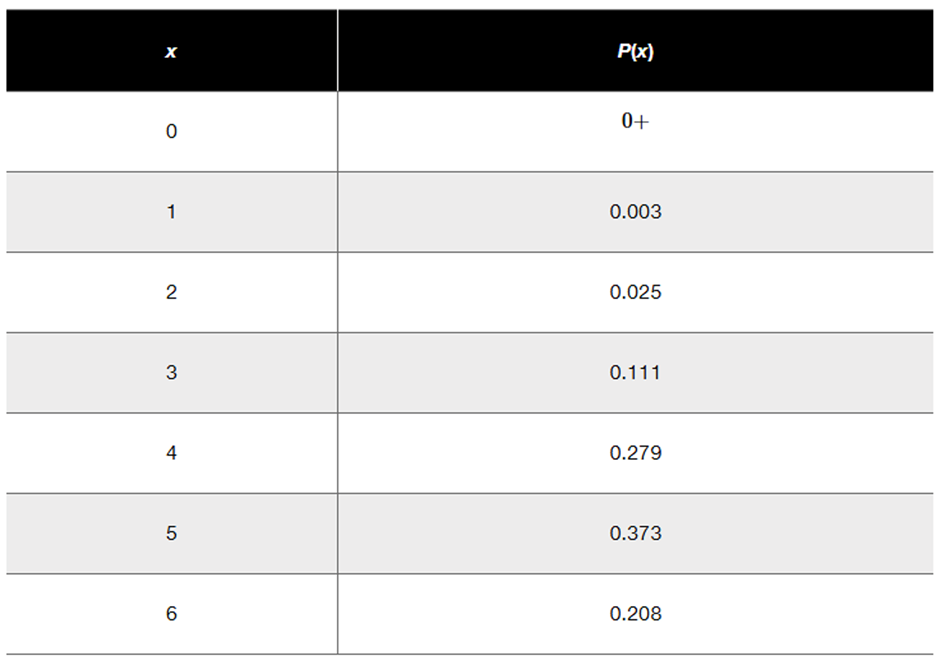
Family/Partner Groups of people aged 15–65 are randomly selected and arranged in groups of six. The random variable x is the number in the group who say that their family and/or partner contribute most to their happiness (based on a Coca-Cola survey). The accompanying table lists the values of x along with their corresponding probabilities. Does the table describe a probability distribution? If so, find the mean and standard deviation.
 Verified step by step guidance
1
Step 1: Verify if the table describes a probability distribution. To do this, check two conditions: (a) All probabilities P(x) must be between 0 and 1, inclusive, and (b) The sum of all probabilities P(x) must equal 1.
Step 2: Calculate the sum of all probabilities P(x) from the table: \( P(0) + P(1) + P(2) + P(3) + P(4) + P(5) + P(6) \). Ensure the sum equals 1 to confirm it is a valid probability distribution.
Step 3: To find the mean (expected value), use the formula \( \mu = \sum [x \cdot P(x)] \), where \( x \) is the value of the random variable and \( P(x) \) is its corresponding probability. Multiply each \( x \) by its \( P(x) \), then sum the results.
Step 4: To find the variance, use the formula \( \sigma^2 = \sum [(x - \mu)^2 \cdot P(x)] \). Subtract the mean \( \mu \) from each \( x \), square the result, multiply by \( P(x) \), and sum these values.
Step 5: To find the standard deviation, take the square root of the variance: \( \sigma = \sqrt{\sigma^2} \). This provides the measure of spread for the probability distribution.
Verified video answer for a similar problem:This video solution was recommended by our tutors as helpful for the problem above
Video duration:
3mWas this helpful?

 7:09m
7:09mWatch next
Master Intro to Random Variables & Probability Distributions with a bite sized video explanation from Patrick
Start learningRelated Videos
Related Practice


