6. Normal Distribution and Continuous Random Variables
Standard Normal Distribution
Problem 5.3.35b
Textbook Question
Finding Specified Data Values In Exercises 31–38, answer the questions about the specified normal distribution.
Advanced Dental Admission Test The Advanced Dental Admission Test (ADAT) is designed so that the scores fit a normal distribution, as shown in the figure. (Source: American Dental Association)
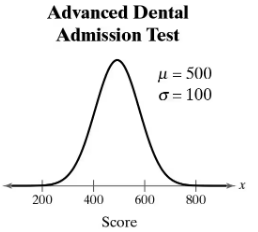
b. Between what two values does the middle 50% of the ADAT scores lie?
 Verified step by step guidance
1
Step 1: Understand the problem. The question asks for the range of values that contain the middle 50% of scores in a normal distribution. This corresponds to the interquartile range (IQR), which is the range between the first quartile (Q1) and the third quartile (Q3).
Step 2: Recall that in a normal distribution, the middle 50% of the data lies between the 25th percentile (Q1) and the 75th percentile (Q3). These percentiles correspond to z-scores of approximately -0.674 and +0.674, respectively.
Step 3: Use the formula for converting z-scores to raw scores: x = μ + zσ, where μ is the mean, σ is the standard deviation, and z is the z-score. For Q1, substitute z = -0.674, μ = 500, and σ = 100 into the formula.
Step 4: Similarly, for Q3, substitute z = +0.674, μ = 500, and σ = 100 into the formula to calculate the raw score corresponding to the 75th percentile.
Step 5: The middle 50% of the scores lies between the raw scores calculated for Q1 and Q3. These values represent the interquartile range of the ADAT scores.
Verified video answer for a similar problem:This video solution was recommended by our tutors as helpful for the problem above
Video duration:
4mWas this helpful?
Key Concepts
Here are the essential concepts you must grasp in order to answer the question correctly.
Normal Distribution
A normal distribution is a probability distribution that is symmetric about the mean, showing that data near the mean are more frequent in occurrence than data far from the mean. It is characterized by its bell-shaped curve, defined by its mean (μ) and standard deviation (σ). In this case, the ADAT scores follow a normal distribution with a mean of 500 and a standard deviation of 100.
Recommended video:

 06:23
06:23Using the Normal Distribution to Approximate Binomial Probabilities
Interquartile Range (IQR)
The interquartile range (IQR) is a measure of statistical dispersion and represents the range within which the middle 50% of data points lie. It is calculated as the difference between the first quartile (Q1) and the third quartile (Q3). For a normal distribution, the IQR can be found using z-scores corresponding to the 25th and 75th percentiles.
Recommended video:
Guided course
 05:45
05:45Find 5-Number Summary - TI-84 Calculator Example 1
Z-scores
A z-score indicates how many standard deviations an element is from the mean. In the context of a normal distribution, z-scores can be used to find specific percentiles. For example, the z-scores for the 25th and 75th percentiles are approximately -0.674 and 0.674, respectively, which can be used to calculate the corresponding ADAT scores that encompass the middle 50% of the distribution.
Recommended video:
Guided course
 06:31
06:31Z-Scores From Given Probability - TI-84 (CE) Calculator
 9:47m
9:47mWatch next
Master Finding Standard Normal Probabilities using z-Table with a bite sized video explanation from Patrick
Start learning

