3. Describing Data Numerically
Median
Problem 2.3.65a
Textbook Question
Extending Concepts
Data Analysis Students in an experimental psychology class did research on depression as a sign of stress. A test was administered to a sample of 30 students. The scores are shown in the table at the left.
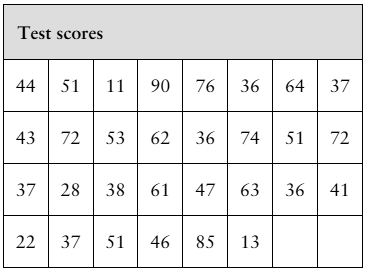
a. Find the mean and the median of the data.
 Verified video answer for a similar problem:
This video solution was recommended by our tutors as helpful for the problem above
Video duration:
1mWas this helpful?
Key Concepts
Here are the essential concepts you must grasp in order to answer the question correctly.
Mean
The mean, or average, is calculated by summing all the values in a dataset and dividing by the number of values. It provides a central value that represents the dataset, but can be influenced by extreme values (outliers). For example, in the given test scores, the mean would give an overall sense of the students' performance.
Recommended video:
Guided course

 04:52
04:52Calculating the Mean
Median
The median is the middle value of a dataset when it is ordered from least to greatest. If there is an even number of observations, the median is the average of the two middle numbers. This measure is less affected by outliers and provides a better representation of the central tendency in skewed distributions, making it useful for analyzing the test scores.
Recommended video:
Guided course
 03:26
03:26Calculating the Median
Data Distribution
Data distribution refers to how values are spread or arranged in a dataset. Understanding the distribution helps in identifying patterns, trends, and the presence of outliers. In the context of the test scores, analyzing the distribution can reveal insights about the overall performance of the students and how their scores relate to each other.
Recommended video:
Guided course
 04:39
04:39Visualizing Qualitative vs. Quantitative Data
 3:26m
3:26mWatch next
Master Calculating the Median with a bite sized video explanation from Patrick
Start learning

