6. Normal Distribution and Continuous Random Variables
Standard Normal Distribution
Struggling with Statistics?
Join thousands of students who trust us to help them ace their exams!Watch the first videoMultiple Choice
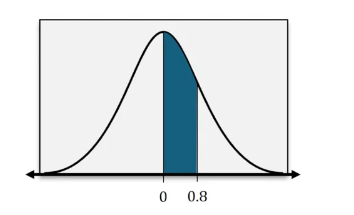
Find the area of the shaded region under the standard normal distribution.
A
0.7881
B
0.7119
C
0.2119
D
0.2881
 Verified step by step guidance
1
Identify the shaded region on the standard normal distribution curve. The shaded area is between the z-scores of 0 and 0.8.
Understand that the standard normal distribution is symmetric around the mean, which is 0, and has a standard deviation of 1.
Use the standard normal distribution table (z-table) to find the area to the left of the z-score 0.8. This value represents the cumulative probability from the left up to 0.8.
Find the area to the left of the z-score 0, which is 0.5, since the mean of the standard normal distribution is 0.
Subtract the area to the left of z = 0 from the area to the left of z = 0.8 to find the area of the shaded region. This will give you the probability of the z-score being between 0 and 0.8.

 9:47m
9:47mWatch next
Master Finding Standard Normal Probabilities using z-Table with a bite sized video explanation from Patrick
Start learning


