2. Describing Data with Tables and Graphs
Histograms
Problem 2.5.57a
Textbook Question
Song Lengths Side-by-side box-and-whisker plots can be used to compare two or more different data sets. Each box-and-whisker plot is drawn on the same number line to compare the data sets more easily. The lengths (in seconds) of songs played at two different concerts are shown.
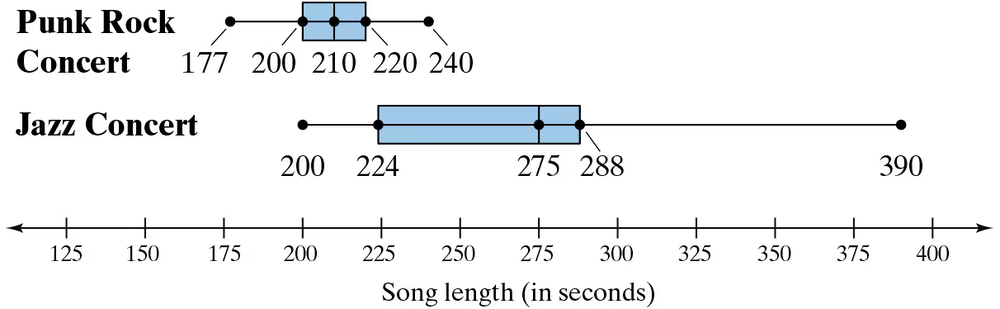
a. Describe the shape of each distribution. Which concert has less variation in song lengths?
 Verified step by step guidance
1
Step 1: Observe the box-and-whisker plots for both concerts. The Punk Rock Concert has a box that is more compact, indicating less variation in song lengths. The Jazz Concert has a wider box and longer whiskers, suggesting greater variation in song lengths.
Step 2: Describe the shape of the distribution for the Punk Rock Concert. The box is relatively small, and the whiskers are short, indicating that the data is tightly clustered around the median. This suggests a more consistent song length.
Step 3: Describe the shape of the distribution for the Jazz Concert. The box is wider, and the whiskers are longer, indicating that the data is more spread out. This suggests a greater range of song lengths.
Step 4: Compare the interquartile ranges (IQR) of both concerts. The IQR for the Punk Rock Concert is from 200 to 220 seconds, which is 20 seconds. The IQR for the Jazz Concert is from 224 to 288 seconds, which is 64 seconds. This confirms that the Jazz Concert has more variation in song lengths.
Step 5: Compare the overall range of song lengths. The range for the Punk Rock Concert is from 177 to 240 seconds, which is 63 seconds. The range for the Jazz Concert is from 200 to 390 seconds, which is 190 seconds. This further supports that the Jazz Concert has greater variation in song lengths.
Verified video answer for a similar problem:This video solution was recommended by our tutors as helpful for the problem above
Video duration:
2mWas this helpful?
Key Concepts
Here are the essential concepts you must grasp in order to answer the question correctly.
Box-and-Whisker Plot
A box-and-whisker plot is a graphical representation of a data set that displays its minimum, first quartile, median, third quartile, and maximum. The 'box' shows the interquartile range (IQR), which contains the middle 50% of the data, while the 'whiskers' extend to the smallest and largest values within 1.5 times the IQR from the quartiles. This visualization helps in comparing distributions and identifying outliers.
Recommended video:
Guided course

 07:38
07:38Residuals and Residual Plots
Variation in Data
Variation refers to how spread out or clustered the data points are within a data set. It can be assessed using measures such as range, variance, and standard deviation. In the context of box-and-whisker plots, a smaller interquartile range indicates less variation, meaning the data points are closer to the median, while a larger IQR suggests greater variability among the data points.
Recommended video:
Guided course
 04:39
04:39Visualizing Qualitative vs. Quantitative Data
Distribution Shape
The shape of a distribution describes how data points are arranged across the range of values. Common shapes include normal (bell-shaped), skewed (asymmetrical), and uniform (evenly spread). Analyzing the shape helps in understanding the underlying characteristics of the data, such as whether it has outliers or if it is concentrated around certain values, which is crucial for interpreting the results of the concerts' song lengths.
Recommended video:
 05:11
05:11Sampling Distribution of Sample Proportion

Related Videos
Related Practice

