Table of contents
- 1. Intro to Stats and Collecting Data55m
- 2. Describing Data with Tables and Graphs1h 55m
- 3. Describing Data Numerically1h 45m
- 4. Probability2h 16m
- 5. Binomial Distribution & Discrete Random Variables2h 33m
- 6. Normal Distribution and Continuous Random Variables1h 38m
- 7. Sampling Distributions & Confidence Intervals: Mean1h 3m
- 8. Sampling Distributions & Confidence Intervals: Proportion1h 12m
- 9. Hypothesis Testing for One Sample1h 1m
- 10. Hypothesis Testing for Two Samples2h 8m
- 11. Correlation48m
- 12. Regression1h 4m
- 13. Chi-Square Tests & Goodness of Fit1h 20m
- 14. ANOVA1h 0m
6. Normal Distribution and Continuous Random Variables
Standard Normal Distribution
Problem 12.CR.6a
Textbook Question
Quarters Assume that weights of quarters minted after 1964 are normally distributed with a mean of 5.670 g and a standard deviation of 0.062 g (based on U.S. Mint specifications).
a. Find the probability that a randomly selected quarter weighs between 5.600 g and 5.700 g..
 Verified step by step guidance
1
Step 1: Identify the key parameters of the normal distribution. The mean (╬╝) is 5.670 g, and the standard deviation (¤â) is 0.062 g. The problem asks for the probability that a randomly selected quarter weighs between 5.600 g and 5.700 g.
Step 2: Standardize the given weights (5.600 g and 5.700 g) into z-scores using the z-score formula: z = (x - ╬╝) / ¤â. For each weight, substitute the values of x (the weight), ╬╝ (the mean), and ¤â (the standard deviation).
Step 3: Calculate the z-scores for both bounds. For the lower bound (5.600 g), compute z = (5.600 - 5.670) / 0.062. For the upper bound (5.700 g), compute z = (5.700 - 5.670) / 0.062.
Step 4: Use a standard normal distribution table or a statistical software to find the cumulative probabilities corresponding to the calculated z-scores. These cumulative probabilities represent the area under the standard normal curve to the left of each z-score.
Step 5: Subtract the cumulative probability of the lower z-score from the cumulative probability of the upper z-score. This difference gives the probability that a randomly selected quarter weighs between 5.600 g and 5.700 g.
 Verified video answer for a similar problem:
This video solution was recommended by our tutors as helpful for the problem above
Video duration:
5mPlay a video:
Was this helpful?
Key Concepts
Here are the essential concepts you must grasp in order to answer the question correctly.
Normal Distribution
Normal distribution is a probability distribution that is symmetric about the mean, depicting that data near the mean are more frequent in occurrence than data far from the mean. It is characterized by its bell-shaped curve, defined by its mean and standard deviation. In this context, the weights of quarters follow a normal distribution, allowing us to use statistical methods to find probabilities related to specific weight ranges.
Recommended video:
Guided course

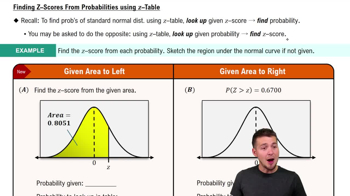
Finding Standard Normal Probabilities using z-Table
Z-Score
A Z-score is a statistical measurement that describes a value's relationship to the mean of a group of values. It is calculated by subtracting the mean from the value and then dividing by the standard deviation. In this problem, Z-scores will be used to standardize the weights of the quarters to find the probability of a quarter weighing between 5.600 g and 5.700 g.
Recommended video:
Guided course

Z-Scores From Given Probability - TI-84 (CE) Calculator
Probability Calculation
Probability calculation involves determining the likelihood of a specific event occurring within a defined set of outcomes. For normally distributed data, this often requires using Z-scores to reference standard normal distribution tables or software to find the area under the curve that corresponds to the desired range of values. In this case, we will calculate the probability that a quarter's weight falls between the specified limits.
Recommended video:
Guided course

Probability From Given Z-Scores - TI-84 (CE) Calculator

 9:47m
9:47mWatch next
Master Finding Standard Normal Probabilities using z-Table with a bite sized video explanation from Patrick
Start learning

