6. Normal Distribution and Continuous Random Variables
Probabilities & Z-Scores w/ Graphing Calculator
Struggling with Statistics?
Join thousands of students who trust us to help them ace their exams!Watch the first videoMultiple Choice
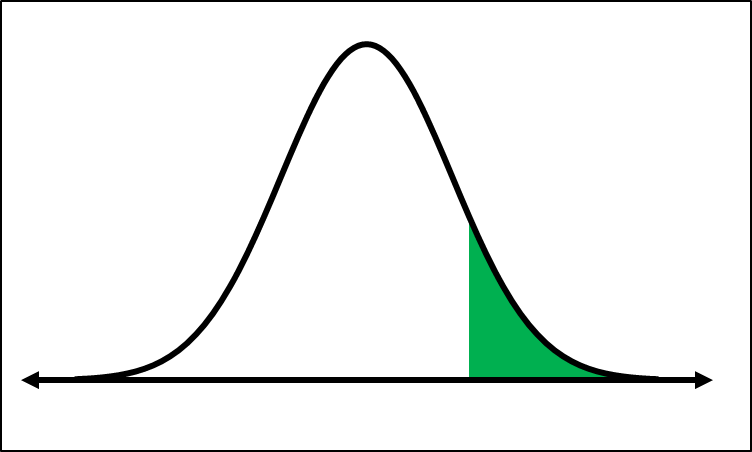
Sketch a graph to represent the probability, then use a calculator to find it.
A
0.1271
B
0.1271

C
0.8729

D
0.8729
 Verified step by step guidance
1
Identify the problem as finding the probability that a standard normal variable Z is greater than 1.14, denoted as P(Z > 1.14).
Understand that the standard normal distribution is symmetric around zero, with a mean of 0 and a standard deviation of 1.
Sketch the standard normal distribution curve, which is bell-shaped, and shade the area to the right of Z = 1.14. This shaded area represents P(Z > 1.14).
Use a standard normal distribution table (Z-table) or a calculator with statistical functions to find the cumulative probability P(Z < 1.14).
Subtract the cumulative probability from 1 to find P(Z > 1.14), since the total area under the curve is 1. This gives you the probability of Z being greater than 1.14.

 7:09m
7:09mWatch next
Master Probability From Given Z-Scores - TI-84 (CE) Calculator with a bite sized video explanation from Patrick
Start learningRelated Videos
Related Practice


