6. Normal Distribution and Continuous Random Variables
Probabilities & Z-Scores w/ Graphing Calculator
Problem 5.3.34b
Textbook Question
Finding Specified Data Values In Exercises 31ŌĆō38, answer the questions about the specified normal distribution.
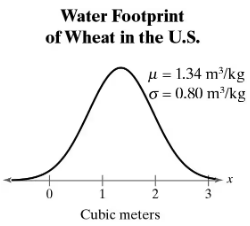
Water Footprint A water footprint is a measure of the appropriation of fresh water. The water footprint (in cubic meters) for a kilogram of wheat can be approximated by a normal distribution, as shown in the figure. (Source: Ecological Indicators)
b. What water footprint represents the 29th percentile?
 Verified step by step guidance
1
Step 1: Understand the problem. The question asks for the water footprint value that corresponds to the 29th percentile in a normal distribution. The normal distribution is defined by a mean (╬╝ = 1.34 m┬│/kg) and a standard deviation (Žā = 0.80 m┬│/kg). Percentiles represent the position of a value in the distribution relative to the rest of the data.
Step 2: Convert the percentile into a z-score. The z-score is a standardized value that corresponds to the given percentile in the standard normal distribution. Use a z-score table or statistical software to find the z-score for the 29th percentile. For example, the z-score for the 29th percentile is approximately -0.55.
Step 3: Use the z-score formula to find the corresponding value in the normal distribution. The formula is: x = ╬╝ + zŽā, where x is the value in the normal distribution, ╬╝ is the mean, z is the z-score, and Žā is the standard deviation.
Step 4: Substitute the values into the formula. Plug in ╬╝ = 1.34, z = -0.55, and Žā = 0.80 into the formula x = ╬╝ + zŽā.
Step 5: Simplify the expression to find the water footprint value corresponding to the 29th percentile. This will give you the final result in cubic meters.
Verified video answer for a similar problem:This video solution was recommended by our tutors as helpful for the problem above
Video duration:
2mWas this helpful?
Key Concepts
Here are the essential concepts you must grasp in order to answer the question correctly.
Normal Distribution
A normal distribution is a continuous probability distribution characterized by its bell-shaped curve, defined by its mean (╬╝) and standard deviation (Žā). In this context, the water footprint of wheat follows a normal distribution, indicating that most values cluster around the mean, with fewer occurrences as you move away from it.
Recommended video:

 06:23
06:23Using the Normal Distribution to Approximate Binomial Probabilities
Percentiles
A percentile is a measure used in statistics to indicate the value below which a given percentage of observations fall. For example, the 29th percentile represents the value below which 29% of the data points lie. Understanding percentiles is crucial for interpreting the distribution of data and identifying specific thresholds.
Z-scores
A Z-score is a statistical measurement that describes a value's relationship to the mean of a group of values, expressed in terms of standard deviations. It is calculated by subtracting the mean from the value and dividing by the standard deviation. Z-scores are essential for finding percentiles in a normal distribution, as they allow for the conversion of raw scores into a standardized format.
Recommended video:
Guided course
 06:31
06:31Z-Scores From Given Probability - TI-84 (CE) Calculator
 7:09m
7:09mWatch next
Master Probability From Given Z-Scores - TI-84 (CE) Calculator with a bite sized video explanation from Patrick
Start learningRelated Videos
Related Practice
