Table of contents
- 1. Intro to Stats and Collecting Data55m
- 2. Describing Data with Tables and Graphs1h 55m
- 3. Describing Data Numerically1h 45m
- 4. Probability2h 16m
- 5. Binomial Distribution & Discrete Random Variables2h 33m
- 6. Normal Distribution and Continuous Random Variables1h 38m
- 7. Sampling Distributions & Confidence Intervals: Mean1h 3m
- 8. Sampling Distributions & Confidence Intervals: Proportion1h 12m
- 9. Hypothesis Testing for One Sample1h 1m
- 10. Hypothesis Testing for Two Samples2h 8m
- 11. Correlation48m
- 12. Regression1h 4m
- 13. Chi-Square Tests & Goodness of Fit1h 20m
- 14. ANOVA1h 0m
6. Normal Distribution and Continuous Random Variables
Standard Normal Distribution
Problem 11.1.25b
Textbook Question
Testing Goodness-of-Fit with a Normal Distribution Refer to Data Set 1 “Body Data” in Appendix B for the heights of females.

b. Assuming a normal distribution with mean and standard deviation given by the sample mean and standard deviation, use the methods of Chapter 6 to find the probability of a randomly selected height belonging to each class.
 Verified video answer for a similar problem:
This video solution was recommended by our tutors as helpful for the problem above
Video duration:
8mPlay a video:
Was this helpful?
Key Concepts
Here are the essential concepts you must grasp in order to answer the question correctly.
Normal Distribution
Normal distribution is a continuous probability distribution characterized by its bell-shaped curve, defined by its mean and standard deviation. In this context, it is assumed that the heights of females follow this distribution, allowing for the application of statistical methods to analyze the data. The properties of normal distribution, such as symmetry and the empirical rule, are crucial for understanding how data is expected to behave.
Recommended video:
Guided course

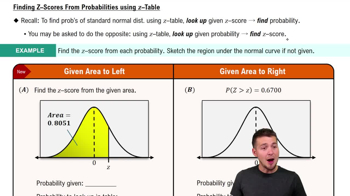
Finding Standard Normal Probabilities using z-Table
Goodness-of-Fit Test
A goodness-of-fit test assesses how well a statistical model fits a set of observations. In this case, it evaluates whether the observed frequencies of female heights align with the expected frequencies derived from the normal distribution. Common tests include the Chi-square test, which compares observed and expected frequencies to determine if there are significant deviations.
Recommended video:
Guided course

Step 2: Calculate Test Statistic
Probability and Class Intervals
Probability in this context refers to the likelihood of a randomly selected height falling within specified class intervals. The class intervals provided in the table categorize heights into ranges, and calculating the probability involves determining the proportion of the total sample that falls within each range. This is essential for interpreting the distribution of heights and understanding how they relate to the normal distribution.
Recommended video:
Guided course

Prediction Intervals

 9:47m
9:47mWatch next
Master Finding Standard Normal Probabilities using z-Table with a bite sized video explanation from Patrick
Start learning

