6. Normal Distribution and Continuous Random Variables
Standard Normal Distribution
Problem 6.6.10
Textbook Question
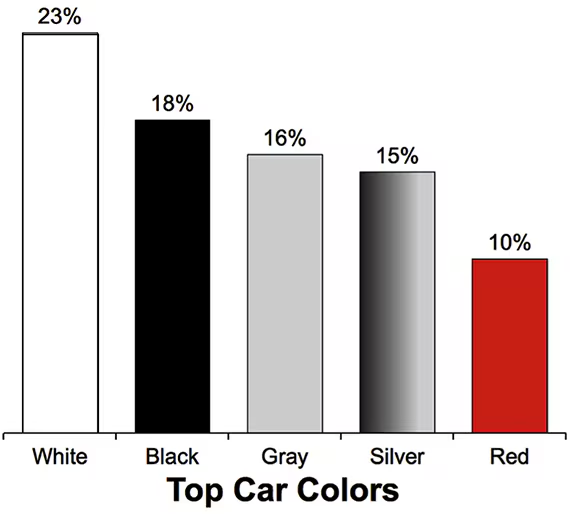
Car Colors
In Exercises 9–12, assume that 100 cars are randomly selected. Refer to the accompanying graph, which shows the top car colors and the percentages of cars with those colors (based on PPG Industries).
Black Cars Find the probability that at least 25 cars are black. Is 25 a significantly high number of black cars?
 Verified step by step guidance
1
Step 1: Identify the probability of selecting a black car from the graph. The graph shows that 18% of cars are black, which corresponds to a probability of 0.18.
Step 2: Define the random variable X as the number of black cars in a sample of 100 cars. Since the selection is random, X follows a binomial distribution with parameters n = 100 (number of trials) and p = 0.18 (probability of success).
Step 3: To find the probability that at least 25 cars are black, calculate P(X ≥ 25). This can be expressed as 1 - P(X ≤ 24). Use the cumulative probability formula for the binomial distribution or a statistical software/calculator to compute P(X ≤ 24).
Step 4: To determine if 25 is a significantly high number of black cars, calculate the mean and standard deviation of the binomial distribution. The mean is μ = n * p = 100 * 0.18, and the standard deviation is σ = √(n * p * (1 - p)) = √(100 * 0.18 * 0.82).
Step 5: Use the rule of thumb for significant values: a value is considered significantly high if it is greater than μ + 2σ. Compare 25 to μ + 2σ to determine if it is significantly high.
Verified video answer for a similar problem:This video solution was recommended by our tutors as helpful for the problem above
Video duration:
6mWas this helpful?
Key Concepts
Here are the essential concepts you must grasp in order to answer the question correctly.
Probability
Probability is a measure of the likelihood that a particular event will occur, expressed as a number between 0 and 1. In this context, it involves calculating the chance of selecting at least 25 black cars from a sample of 100, based on the percentage of black cars (18%) in the population. Understanding probability helps in making informed predictions about outcomes in random sampling.
Recommended video:

 5:37
5:37Introduction to Probability
Binomial Distribution
The binomial distribution is a statistical distribution that describes the number of successes in a fixed number of independent Bernoulli trials, each with the same probability of success. In this scenario, selecting black cars can be modeled using a binomial distribution, where 'success' is defined as selecting a black car. This concept is crucial for determining the probability of observing at least 25 black cars in the sample.
Recommended video:
Guided course
 03:28
03:28Mean & Standard Deviation of Binomial Distribution
Statistical Significance
Statistical significance refers to the likelihood that a result or relationship is caused by something other than mere random chance. In this question, determining whether 25 black cars is a significantly high number involves comparing the observed frequency against what would be expected under the binomial distribution. This helps in assessing whether the observed outcome is unusual or expected based on the given probabilities.
Recommended video:
Guided course
 05:53
05:53Parameters vs. Statistics
 9:47m
9:47mWatch next
Master Finding Standard Normal Probabilities using z-Table with a bite sized video explanation from Patrick
Start learning


